Odds Explained: In, For, & To
| Odds Type | Example | Meaning |
| IN | 1 in 10 | 10% chance, p=0.10 of outcome |
| FOR | 1 for 10 | a bet pays off at 1 to 9 odds |
| TO | 1 to 10 | a bet pays off at 1 for 11 odds |
In is a statement of probability (and probability is commonly denoted by the letter p, goes by the alias of chance, and is equal to 1/odds), while For and To indicate a pay-off schedule to a wager and do not necessarily have any intrinsic link to the underlying probabilities involved (the appeal of horse racing or sports betting being, perhaps, that one can make money arbitrating the difference between the true odds of winning and the pay off odds being offered, but that is a subject for another paper).
Odds: In, For, & To
A Few Practical Examples
| GAME | IN (is 1/p, a probability) | FOR (a pay off, wager is sacrificed) | TO (a pay off, wager is kept) |
| Coin Toss | 1 in 2, p=1/2=0.5000 | 1 for 2 (pays 2, wager is sacrificed: win nets +1) | 1 to 1 (pays 1, wager is kept, win nets +1) |
| Craps | 1 in 2.0287, p=1/2.0287=0.4929 | 1 for 2 (pays 2, wager is sacrificed: win nets +1) | 1 to 1 (pays 1, wager is kept, win nets +1) |
| Blackjack | 1 in 2.1570, p=1/2.1570=0.4636 | 1 for 2 (pays 2, wager is sacrificed: win nets +1) | 1 to 1 (pays 1, wager is kept, win nets +1) |
| Roulette | 1 in 38, p=1/38=0.0263 | 1 for 36 (pays 36, wager is sacrificed: win nets +35) | 1 to 35 (pays 35, wager is kept, win nets +35) |
Coin Toss shall be used throughout this document as the default Fair even money game. Fair in this context means that In, For, and To are all mathematically related. And used in this sense, one does not normally find Fair games in either Casinos or State Lotteries (the difference typically being denoted as the House Edge).
Casino games are generally played at To odds with the wager staying on the table.
Race track betting is generally played at For odds as the bet is sacrificed in advance in exchange for a ticket that if it is a winner pays off a certain amount. For example: a ticket might be bought for $1, which pays off at $3, which indicates a profit over and above the ticket price of $2. This would be an example of a 1 for 3 bet.
The California Lottery publishes the odds to their games in the In odds format, which means the probability (p) for the same event is 1/odds, which I also call chance throughout this document. Prizes have nothing to do with chance, however, and so the lottery denotes these as 'Prize Amounts'. As with Casinos, Race Tracks, and Sports Betting, the Odds and the pay off in the California Lottery are not directly linked. It is in this fact (if no other) that might lead one to ask, 'Which game is the best game to play?' But before we get to a place where we can answer than question, we have a long way to go.
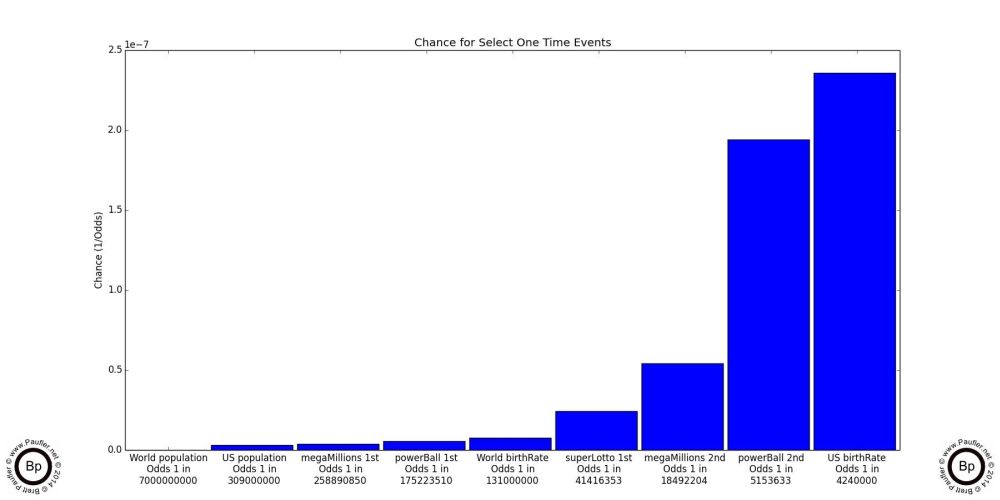
The graph shows the probability of certain rarefied events (being selected at random from the total world population, the US population, winning the Mega Millions, and so on). Shown below is the same information in table form.
Raw Odds Table for Armchair Philosophers
| Category | Odds: 1 in |
| World Population | 7,000,000,000 |
| US Population | 309,000,000 |
| Mega Millions 1st prize | 258,890,850 |
| Power Ball 1st prize | 175,223,510 |
| World birthRate | 131,000,000 |
| Super Lotto 1st prize | 41,416,353 |
| Mega Millions 2nd | 18,492,204 |
| Power Ball 2nd prize | 5,153,633 |
| US birthRate | 4,240,000 |
What follows has more to do with philosophy than anything else. It's a way of looking at the the world and one's place in it vis a vie the odds of certain remote possibilities that very many of us strive for in one way or another. So while it is true that the World Population has nothing to do with the odds of winning the lottery, it is a benchmark of sorts. For example, one Nobel Prize in Mathematics is awarded each year. All other things being equal, one's odds of being a winner of the Nobel Prize in Mathematics approaches 1 in the Birthrate of the World. I hope that makes sense. As a starting point in figuring the odds for any yearly worldwide event, the World Birthrate makes for a fine benchmark. By the same token, if something is only going to happen to one person on the planet ever, one could do worse than start with the world population as the pool of possible candidates. Of course, all things are not equal, but in the absence of additional data so as to narrow the selection, it makes for a starting point. A more complicated example would be to figure sight unseen the odds that a random American second grader will grow up to become president. All things being equal, which they never are, the odds of this reduces to something along the lines of of 1 in (4 * The US Birthrate). Of course, we can improve on this approximation a little bit more by reasoning that the average president, though elected every four years, stays in office for around six years, and so refine the odds as to whether a random second grader will grow up to be President of the United States someday as 1 in (6 * The US Birthrate).
I'm guessing that more folks wish to become Movie Stars (or Rock and Roll Legends, Famous Authors, and so on) than the president, but the odds for these things can be figured in a similar vein. Take the total pool of possible applicants, which since life is a moving conveyor belt of interest and opportunity would be some birthrate, and then multiply that rate by how long a typical reign of popularity lasts (average length of startdom) and divide it by the number of 'successes' there are in the particular field of interest at any one time.
I like writing, so let's look at what might be a reasonable approximation for the odds that someone will grow up to become a Famous American Author.
Guestimate Chance of Child Becoming a Great American Author
| US birthRate | 4,240,000/year |
| Great American Authors | 100 at any time |
| Reign of Popularity | 25 years |
Odds Equals 1 in BirthRate * HowLongReign / NumberAtOnce.
Thus, the Odds of a Random American growing up to become an All American Author can be approximated at 1 in 1,060,000 or essentially 1 in a Million.
Yet, many people strive for such an outcome. And I suppose, one could argue the numbers. But the essential point is that many folks will spend the time and energy it takes to write a novel in the hopes of fame and notoriety, but few will succeed. Yet, and let me restate this, many will do so nonetheless, because 'You have to try', because 'Nothing ventured, nothing gained', because 'You have to do something with your life', and so on and so forth. Meaning despite the odds, because of a long shot promise, a dream, or any number of other reasons, folks will write novels. And it's not silly or futile or stupid or being ignorant of the odds. It's in many ways because there are no other options. Certainly, if one wants to become a celebrated author, one must write, despite the fact that most writing goes unread.
And here we come back to the lottery and what this seeming digression was all about in the first place. Like the author who finds that no one is interested in their novel, the average person who buys a lottery ticket will not win a jackpot. But to say that the average person will lose is an empty statement. It has no meaning. In almost every endeavour in which the rewards are as high as they are in the lottery (in fact I am not aware of a single rarefied endeavour in which this is not true), the number of people who will try, who will metaphorically buy a ticket, far outstrips those who will win. But as they say, you can't win if you don't play. And just like in writing books, the more one writes, the more likely one is to succeed; and, well, believe it or not, the more lottery tickets one buys, the greater their chances of winning the big one. And then, of course, if one chooses the right Lottery Games to play, one can increase their chances even more, which in the end is what this article is all about. But first, let's look at how frequency of betting increases one's odds of winning the big one.
First off, all of the graphs and images on this page have a high degree of resolution and are capable of being enlarged until the smallest of text is legible.
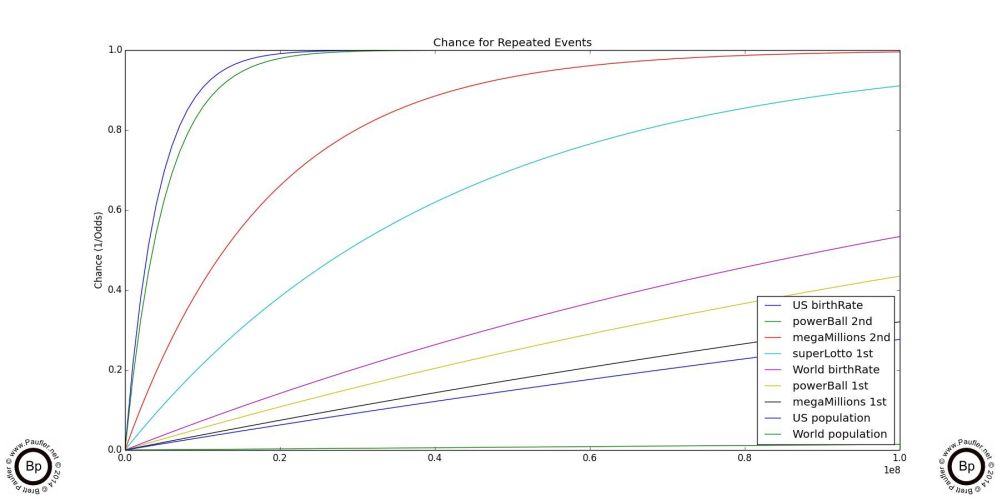
Secondly, although odds is more comprehensible (to me at least), chance really isn't all that esoteric (it is only 1/odds, after all) and it has the added benefit of ALWAYS being a number between zero and one. A chance of zero equals an impossibility. A chance of one equals a certainty. And all other values equalling some degree of probability between those two extremes in a more or less linear fashion. Which means, quite simply, the higher the values on these graphs, the greater the degree of success. And since the range of a probability distribution is known in advance (somewhere between 0-1), one can compare chance graphs quickly and easily, without worrying about the scale.
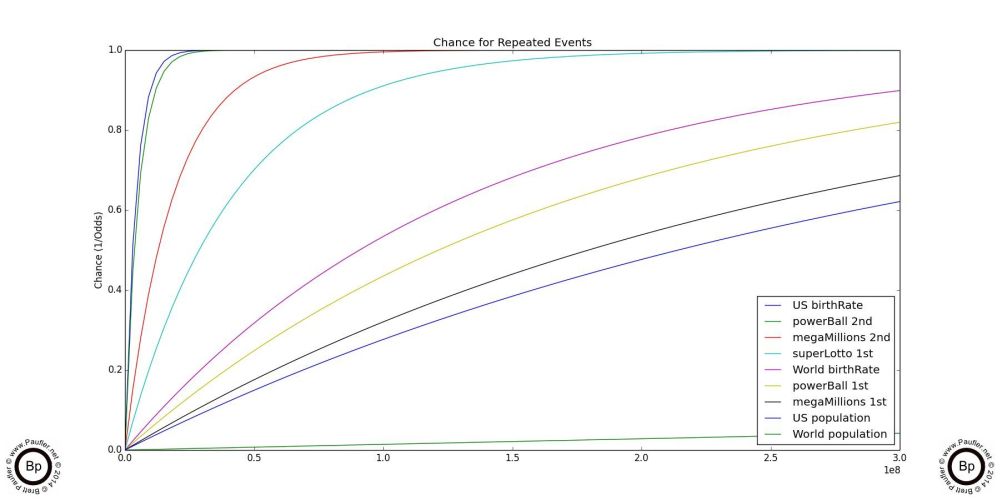
And so, with the generic bookkeeping out of the way, we can look at the above two graphs. These show the increase chance of success of repeated trials over time (buying multiple lottery tickets, selecting people at random from the world population repeatedly; and so on, they're not that lottery specific at this point). And the first thing I want to point out is that as the charts start out (on the left at the beginning, where 1 trial is increased to two, to three, and so on), the lines are virtually linear. This means, that from a practical point of view, a person buying two lottery tickets has roughly twice the chance of winning as a person buying one; and a person who buys ten has essentially ten times the chance; and so on.
Finally, 100,000,000 (the maximum number of trials on graph on the left) and 300,000,000 (the maximum number of trials on the right) are very-very-very large numbers. But even after buying that many lottery tickets winning the Mega Millions jackpot would be far from a certainty. And in fact, the lines sort of level out just short of the top of the chart as the number of trials increases, indicating that winning the lottery would never become an absolute mathematical certainty.
Of course, when you get right down to it, I don't really care about an 'absolute mathematical certainty'. What I (and most likely you) really care about is winning. So of more relevance is at what point might a player be reasonable certain of winning?
Continuing on from the graphs above, the exact formula to find the cumulative chance of success over repeated trials is:
Formula for Trials Over Time: Cumulative Chance for Success
pW = cumulative chance success
p = chance success each trial
q = chance failure each trial (q = 1 - p, typically)
n = number of trials

pW = 1 - (1 - p) ** n
which is equal to
pW = 1 - q**n
Note: ** is standard power notation for Python. It is equivalent to qn or q^n.
Given pW, we can solve for n, which will tell us exactly how many trials (tickets in the case of the lottery) one has to do (or buy) in order to obtain a certain probability of success. Two good numbers for this are 0.50 and 0.95. 0.50 is the halfway mark, the point at which one would have achieved success half the time. 0.95 is often used as a reasonable 'confidence level' in statistical experiments: if something achieves success 95% of the time, perhaps it's more than just luck. However, we won't be winning the lottery 95% of the time (or even 50%, 5%, or even 0.005% of the time). The chart below pretty much explains why.
Number of Trials to Achieve 0.50 & 0.95 Confidence Levels
| Odds Category | Odds | Confidence Level = 0.50 | Confidence Level = 0.95 |
| World population | 7000000000 | 4852029323 | 20970121850 |
| US population | 309000000 | 214182479 | 925681275 |
| Mega Millions 1st | 258890850 | 179449463 | 775567678 |
| Power Ball 1st | 175223510 | 121455681 | 524922720 |
| World birthRate | 131000000 | 90802280 | 392440927 |
| Super Lotto 1st | 41416353 | 28707627 | 124072303 |
| Mega Millions 2nd | 18492204 | 12817818 | 55397690 |
| Power Ball 2nd | 5153633 | 3572225 | 15438903 |
| US birthRate | 4240000 | 2938943 | 12701903 |
And, those numbers are so large as to be sort of meaningless. Of course, the graphs below are also sort of meaningless, too, as the nature of the magnitude does seem to disappear into the gently sloping lines...
Years of Lottery Play Required to Achieve 95% Confidence of Winning
at various wagering levels
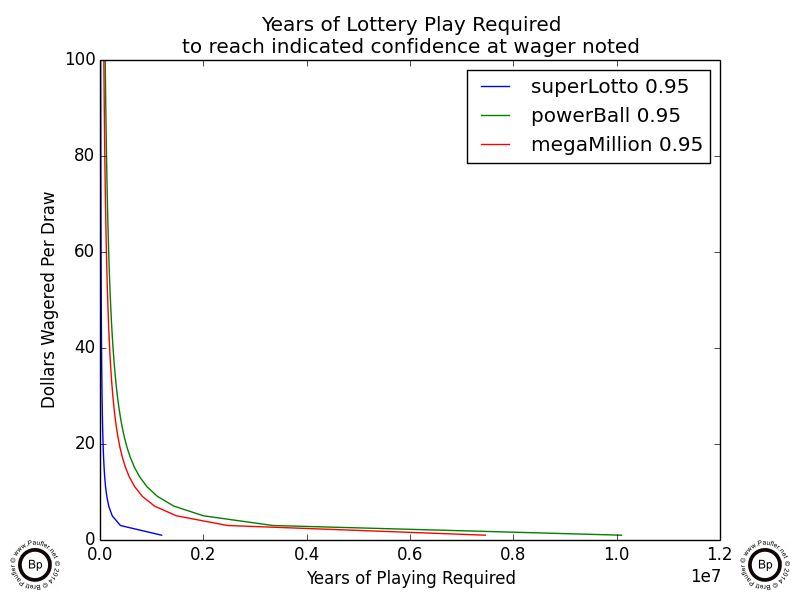

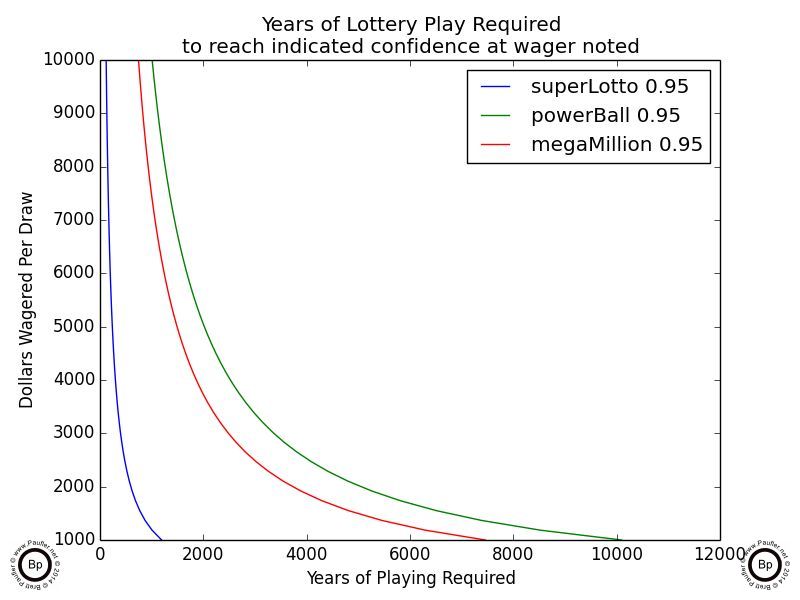
The above charts indicated how many years it would take, betting at X dollars per draw, to have a 95% chance of winning the lottery.
The first chart (upper left, 0.95 confidence) is measured in 107 years: that's 10,000,000 years. More than you, I, or perhaps even the planet is going to last. The last chart in that series (upper right, 0.95 confidence) starts at a wagering level of $1,000 per draw (so only 500 plays for the Power Ball as a ticket costs $2). And I hope we can all agree that if anyone is spending $104,000/year on the lottery ($1000/draw * 52weeks * 2draws/week), they have a problem (and should be doing something better with their money; I'm sure Mr. GigglesWorth could come up with a few suggestions). But even at that level the time line for being assured of winning (at the 0.95 confidence level) is on the magnitude of a thousand years!
Let it not be said that I am delusional about my chances of winning the lottery.
Below is the same data at a 0.50 confidence level (50% chance) of winning. Once again, the time spans indicated are all significantly longer than the typical human will be alive.
Years of Lottery Play Required to Achieve 50% Confidence of Winning
at various wagering levels
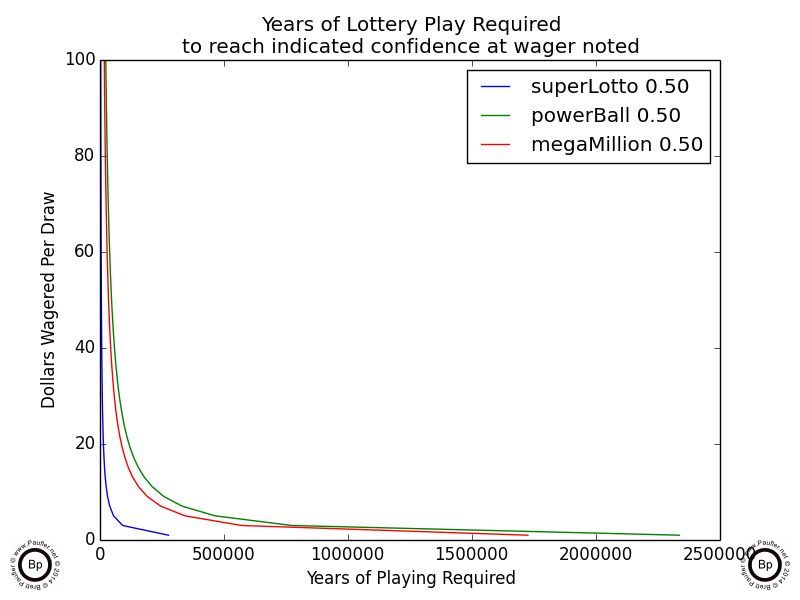

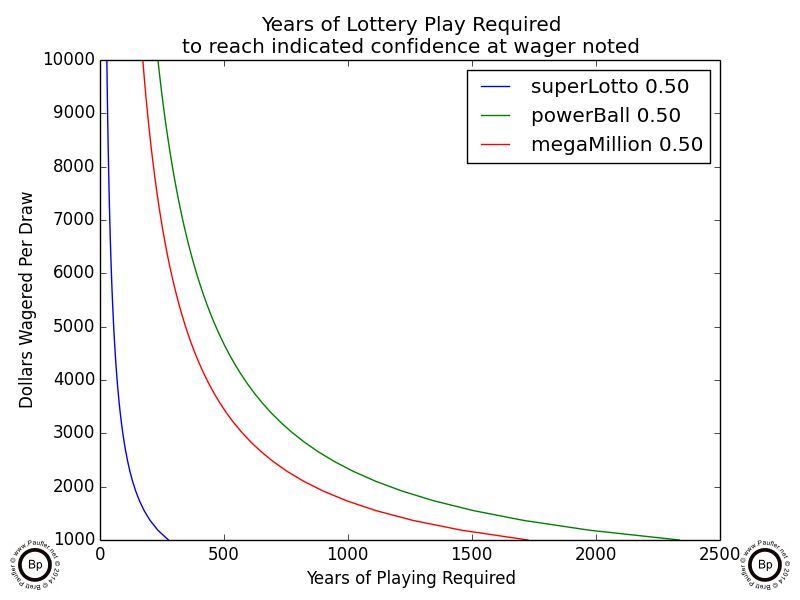
But I still don't think that's the best representation of the data.
Years to Win Playing the Lottery
0.50 & 0.95 Confidence Levels
Wagering $1 - $1000 per Draw
| NAME (confidence level) | $1/draw | $5/draw | $10/draw | $50/draw | $100/draw | $1000/draw |
| Power Ball (95%) | 10094667 | 2018933 | 1009466 | 201893 | 100946 | 10094 |
| Power Ball (50%) | 2335686 | 467137 | 233568 | 46713 | 23356 | 2335 |
| Mega Millions (95%) | 7457381 | 1491476 | 745738 | 149147 | 74573 | 7457 |
| Mega Millions (50%) | 1725475 | 345095 | 172547 | 34509 | 17254 | 1725 |
| Super Lotto (95%) | 1193002 | 238600 | 119300 | 23860 | 11930 | 1193 |
| Super Lotto (50%) | 276034 | 55206 | 27603 | 5520 | 2760 | 276 |
THOSE NUMBERS ARE IN YEARS!!!
So there, that looks pretty good... or not very good, not at all. For the Super Lotto (the lowest odds game) if one spent $1,000/draw ($104,000/year), it would still take 276 years (or well over two life times -- and that's being generous) for a mere 50% overall probability of hitting the jackpot. The truth of the matter is those are pretty crappy odds.
However, all that said, one need not be delusional about one's odds at winning the lottery to consider the lottery a good bet. Which is another way of saying that given that one is going to gamble, playing the lottery might just be (I certainly think that it is) the best of all possible gambling alternatives.
And to understand my reasoning on this, we have to look at the nature of casino gambling and what is known in mathematical circles as The Gambler's Ruin Problem.
But before we get there, a little background first.
Often times (in gambling books and articles especially), it is claimed that craps is the best Casino Game to play as it pays-off as close to a Fair Odds Game (Coin Toss in the chart below) as a person is likely to find in a casino. Of course, some people think that Blackjack is a better bet because they believe that card counting is a thing. But counting cards doesn't really work as card counting systems are easily circumvented by casinos (most easily and directly by simply reshuffling the deck whenever a large bet is made, which I've seen them do; so, there you are). Anyway, below is a basic odds/pay-off chart for a few simple casino games (as I see them, anyway; the only one that's really debatable is the one for blackjack). These are the odds I use throughout the rest of the article to compute the more involved statistics.
Simple Casino Games Odds Chart
| GAME | ODDS (1/p) | CHANCE (p) | PAY OFF (1 for x) |
| Coin Toss | 2.0000 | 0.5000 | 2 |
| Craps | 2.0287 | 0.4929 | 2 |
| Blackjack | 2.1570 | 0.4636 | 2 |
| Roulette | 38.0000 | 0.0263 | 36 |
Now, the same books (and/or articles) which recommend craps as the best game also tend to recommend making a single large bet on the Pass Line (and it is only the Pass Line bet in craps that is a good bet, roulette gives way better odds than many of the side bets available on the craps table); and after making that single bet (win or lose), walking out of the casino never to return. Of course, nobody plays this way. NOBODY! And I mean nobody.
Why? Well, first off, because table games have limits. But secondly, because if you had a million dollars, would you really head off to Vegas to try and double your loot? I know I wouldn't. Gambling for me (and I believe for most people) is about taking a small sum of money and risking it all (all $10, $20, or even $50 on a wild day) in the hopes of walking away with untold millions. And the best way to do that (the best way to maximize one's odds of doing that) is to make a single bet and letting it ride until one has reached the appropriate level of wealth.
Odds of a One Bet Winning Streak for Various Casino Games
| Length of Streak | 1 | 2 | 3 | 4 | 5 | 10 |
| Coin Toss odds 1 in | 2 | 4 | 8 | 16 | 32 | 1024 |
| craps odds 1 in | 2 | 4 | 8 | 16 | 34 | 1180 |
| blackjack odds 1 in | 2 | 4 | 10 | 21 | 46 | 2180 |
| roulette odds 1 in | 38 | 1444 | 54872 | 2085136 | 79235168 | 6278211847988224 |
The odds of winning 1 time in a row on any game is the same as the games odds for that game.
And the generalized formula for finding the one time winning streak odds is simply oddsN, where N is the length of the streak in question.
What's fun about this table is that although the odds of a back to back winning streak in roulette is quite low, I'll eventually show that this is the best game (of these four) to play if one wants to increase their bankroll by more than a trivial amount. So in other words, this is one way of looking at a bet, but maybe not the best way, because if one manages to beat the odds and win ten times in a row at roulette, while letting the money ride; well, if one could find a casino that would take that bet and they won, one would never have to work again in this life or the next or for countless lives to come.
Winning Streak Prize Level pay off Chart for Various Casino Games
| Let It Ride X Times | 1 | 2 | 3 | 4 | 5 | 10 |
| Coin Toss | 2 | 4 | 8 | 16 | 32 | 1024 |
| craps | 2 | 4 | 8 | 16 | 32 | 1024 |
| blackjack | 2 | 4 | 8 | 16 | 32 | 1024 |
| roulette | 36 | 1296 | 46656 | 1679616 | 60466176 | 3656158440062976 |
If one starts with a $1 bet, wins ten times in a row, letting the wager ride the entire way: in Coin Toss, craps, or blackjack, a person winds up with $1,024, while in roulette, they'd have won 3.6, um, what's the number after trillion? Really, who cares? It's enough. So, let's look at this a bit closer.
To recap, the odds to win n straight games is the odds of winning any one game raised to the power of n, so:
P(n) = pn
And the formula for the prize is the same.
$(n) = $n
Or if that's not clear and you like your variable names a little longer:
oddsOfWinningStreak = oddsOfSingleWinlengthOfStreak
totalWinningsFromStreak = singleGameWinningslengthOfStreak
What's important to remember is that these two formulas go together. Yes, the odds of winning (one hand or a single spin) at roulette are worse than those for craps, but the pay off is better. So, chance and prize levels are not isolated statistics, but two parts of the whole. And the best way to see how they play off one another is (in my ever so freaking humble opinion) to look at a graph.
Risk vs Rewards
(i.e. Odds vs pay off)
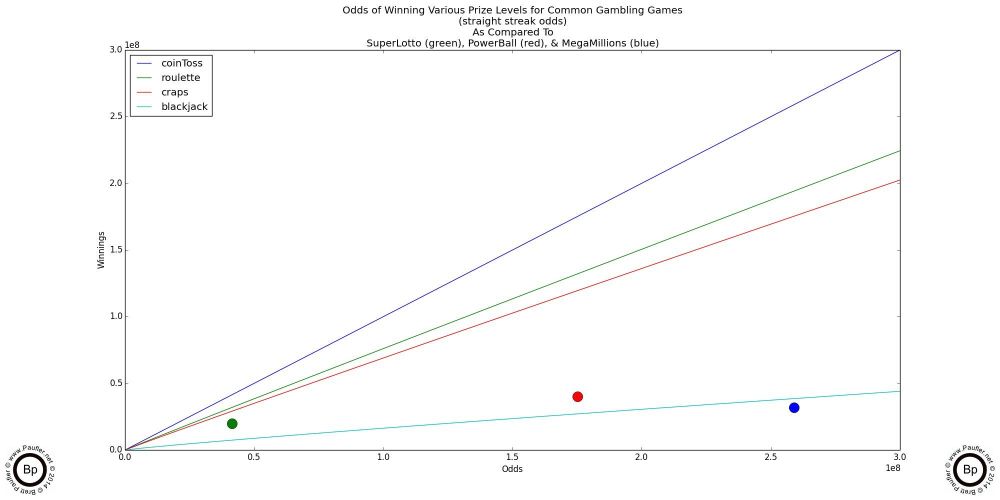
In mathematical terms, the graph plots
Wt = 10 ** (Log(Ot)*log(w)/log(o))
Where:
Wt = Total Winnings
w = Win on a $1 bet
Ot = Total Odds (against)
o = odds of winning a single bet
(or in other words, the graph is logarithmic and involves very large numbers)
But the visual analysis is pretty darn simple, a higher line is better. Coin Toss is the highest line and pays off the best. So, if you can find a millionaire, who likes to gamble, I'd say, give this game a go. Interestingly, the next best game is roulette (not craps, not blackjack). We'll get into why soon enough, as the reasoning behind why roulette is a better gamble than craps, also explains why the lottery is a better gamble still.
Speaking of the lottery (Hey! This is supposed to be a lottery gameplay analysis, right?), well, those three dots at the bottom represent the three major California Lottery Draw Game Jackpots.
Please Note: The lottery jackpots are a moving target; and so, the potential winnings vary from draw to draw (the dots go up and down on a regular basis). This graph is based on information I pulled from the California Lottery Website on 7-11-14 for the 7-12-14 draw. I think it's fairly representative. But clearly, the jackpots amounts make a big difference -- something I shall go into in greater detail further down the line.
For now, suffice to say, that it would appear that the California Lottery games are on par with Blackjack -- a game which many consider to be about as good as it gets. So just shooting from the hip, the lottery's looking pretty 'fair' in terms of it's risk/reward structure.
Of course (and there's always an of course), the above graph isn't based on the real world in that no casino is going to take a million dollar bet straight up; and letting the winnings ride is more of a movie thing than a betting reality. And in this last, I might be off by a little. But when I was a casino gambler (back in the days of my misspent youth and before I knew any better), my game of choice was roulette. And at the 50c table, the maximum pay-off of around $700 corresponded to a $20 bet.
In other words, casinos impose limits. And even at the craps table with it's fairly liberal betting spread (I've seen tables that allowed bets ranging from $1-5,000; and up), this still allows for only twelve doublings before the ceiling is hit: a far cry short of the million dollar pay off I'm hoping for.
Thus, because of betting limits, casinos can never hope to compare with lotteries. But even with this qualification (or shortcoming) if we are going to be fair and honest (or at least, rigorous) in our comparison of lottery games to casino games, we should make some effort to take into account that most folks show up at a casino with a bankroll of a given size and divide this bankroll into smaller units (call these units session limits) and further divide these session limits into individual bets. And this might not sound like such a bad policy, but it is and it's exactly the sort of behaviour that the mathematical problem known as the Gambler's Ruin was designed to analyse: a problem which we shall turn to next, and which will show beyond a doubt that blackjack is a suckers game... assuming, of course, that the sucker in question wants to turn a few bucks into a million... which I can assure you that if that sucker in question is me, the answer is yes, yes he does, and don't be trying to scare me with your Gambler's Ruin mathematical problem name calling thingie.
Math Geeks the world round will recognize the following as the formula for Gambler's Ruin:
P = (1-(p/q)**n)/(1-(p/q)**N
where
p = probability of winning a play
q = probability of loosing a play (1 - p)
n = starting cash (how much can be lost)
N = goal, or ending cash
assuming $1 bets and $1 pay off for wins, then
P = the chance of winning N when starting with n
Non Math Geeks will just have to take my word that it's a well known formula, listed in all the books and treatises, there's no question as to it's veracity, and what it does is generalize the problem of winning streaks. As in, previously I showed the chance that a single bet would result in a winning streak. Well, the Gambler's Ruin Formula reveals the chance that any of a series of bets will result in an overall winning streak. Or if that's still too complicated, it provides the overall odds for a gambling session: the odds one will win or lose in a trip to the casino.
However (and I do seem to like that word, 'However,'), the classic formula ONLY SOLVES ONE PARTICULAR CASE and that's for games that pay off at 1 to 1 odds (Coin Toss, craps, and blackjack, but not roulette, which pays off at 35 to 1 odds). So, if one is interested in higher pay out games (which we are, the lottery being one of those higher payout games), a heavier duty formula is required.
And I cannot begin to express how far beyond my capabilities deriving this formula would be. Oh, I can apply it, but derive it? Not a chance. So, I am grateful to Andrzej S. Kozek for doing the heavy lifting for me.
Please see Kozek's journal article if interested in the finer points of the formula. My Python implementation follows. It's slow - real slow (measured in quarters of hours slow for C's in the thousands, which just isn't that high when one is hoping to win millions). And it probably could do with some major refactoring (like replacing my use of decimal with something faster). But it works. And all the graphs and charts that follow derive from this code. So, um, yeah, check my work if you want...
import decimal
import scipy.misc

def mC(p, q, w, C):
    '''
    '''
    r = int((C-1)/(w+1))
    pqw = p * (q**w)
    mc = []
    for i in range(0, (r+1), 1):
        cC = C - i*w - 1
        cD = scipy.misc.comb(cC, i, exact=True)
        n = (-1)**i
        mc.append(n * cD * pqw**i)
    rV = abs(sum(mc))
    return rV

def gR(p, w, j, C):
    '''p = probability of win
       w = chips if win
       j = starting capital
	   C = goal
    '''
    if 2 * C > 25:
        precision = 2 * C
    else:
        precision = 25

    decimal.getcontext().prec = precision
    p = decimal.Decimal(p)
    q = decimal.Decimal(1-p)
    w = decimal.Decimal(w)
    j = decimal.Decimal(j)
    C = decimal.Decimal(C)

    if j <= 0:
        return 0
    if j >= C:
        return 1
    if abs(p-q) < .0000000001:
        return j/C

    t = decimal.Decimal(mC(p,q,w,(C-j)))
    b = decimal.Decimal(mC(p,q,w,C))
    tb = decimal.Decimal(t / b)
    qj = decimal.Decimal(q ** j)
    tq = decimal.Decimal(tb * qj)
    pF = decimal.Decimal(1 - tq)

    return pF
I'm not going to get into the math (nor even reprint the formula, pull Kozek's article if you're interested). In short, what it does is compute the odds of ending up with C dollars more than one started with, given a game where the chance of winning is p, chance of losing is q (mathematically, a tie would be a third option), and the pay off per bet is w.
And in truth, that doesn't sound much simpler, so maybe you'll just have to take it on faith that the formula works, the code is right (heck, it might not be), and the charts below list the odds (1 in x) of doubling one's money from X to 2X.
Thus, in the first chart below at line blackjack, column 10, one would find the odds of doubling one's money from $10 to $20 while playing blackjack. While by the same token in the third chart down, the line roulette at column 25 shows the odds of doubling one's money from $25 to $50 while playing roulette (on single number bets that pay 35 to 1).
Gambler's Ruin Chance of Doubling One's Money
$1 - $10
| Odds to Double Money | 1 | 2 | 3 | 4 | 5 | 6 | 7 | 8 | 9 | 10 | |
| Coin Toss | 2.00 | 2.00 | 2.00 | 2.00 | 2.00 | 2.00 | 2.00 | 2.00 | 2.00 | 2.00 | |
| roulette | 38.00 | 19.25 | 13.01 | 9.88 | 8.01 | 6.76 | 5.87 | 5.20 | 4.69 | 4.27 | |
| craps | 2.03 | 2.06 | 2.09 | 2.12 | 2.15 | 2.18 | 2.22 | 2.25 | 2.29 | 2.33 | |
| blackjack | 2.16 | 2.34 | 2.55 | 2.79 | 3.07 | 3.40 | 3.78 | 4.21 | 4.72 | 5.30 |
$11 - $20
| Odds to Double Money | 11 | 12 | 13 | 14 | 15 | 16 | 17 | 18 | 19 | 20 | |
| Coin Toss | 2.00 | 2.00 | 2.00 | 2.00 | 2.00 | 2.00 | 2.00 | 2.00 | 2.00 | 2.00 | |
| roulette | 3.93 | 3.65 | 3.41 | 3.21 | 3.03 | 2.88 | 2.74 | 2.62 | 2.60 | 2.58 | |
| craps | 2.36 | 2.40 | 2.44 | 2.49 | 2.53 | 2.57 | 2.62 | 2.66 | 2.71 | 2.76 | |
| blackjack | 5.98 | 6.76 | 7.66 | 8.71 | 9.92 | 11.32 | 12.94 | 14.81 | 16.98 | 19.49 |
$21 - $30
| Odds to Double Money | 21 | 22 | 23 | 24 | 25 | 26 | 27 | 28 | 29 | 30 | |
| Coin Toss | 2.00 | 2.00 | 2.00 | 2.00 | 2.00 | 2.00 | 2.00 | 2.00 | 2.00 | 2.00 | |
| roulette | 2.56 | 2.54 | 2.53 | 2.51 | 2.50 | 2.49 | 2.49 | 2.49 | 2.48 | 2.49 | |
| craps | 2.81 | 2.86 | 2.92 | 2.97 | 3.03 | 3.09 | 3.15 | 3.21 | 3.27 | 3.34 | |
| blackjack | 22.39 | 25.75 | 29.64 | 34.14 | 39.34 | 45.36 | 52.32 | 60.38 | 69.71 | 80.50 |
$31 - $40
| Odds to Double Money | 31 | 32 | 33 | 34 | 35 | 36 | 37 | 38 | 39 | 40 | |
| Coin Toss | 2.00 | 2.00 | 2.00 | 2.00 | 2.00 | 2.00 | 2.00 | 2.00 | 2.00 | 2.00 | |
| roulette | 2.49 | 2.50 | 2.51 | 2.52 | 2.54 | 2.57 | 2.55 | 2.53 | 2.52 | 2.51 | |
| craps | 3.40 | 3.47 | 3.54 | 3.62 | 3.69 | 3.77 | 3.85 | 3.93 | 4.01 | 4.10 | |
| blackjack | 92.98 | 107.43 | 124.14 | 143.48 | 165.85 | 191.74 | 221.69 | 256.34 | 296.44 | 342.83 |
Please Note: The odds to double one's money at Coin Toss or any Fair Even Money Game will always be 1 in 2.
For the most, the above is just a warm up. Seriously, who cares about doubling one's money to a mere $80? How about if one wanted to double their money from $500 (starting bankroll) to $1000 (total after winnings)? Well, the chart below shows them there odds.
Gambler's Ruin Chance of Doubling One's Money
$1 - $500
| Odds to Double Money | 1 | 2 | 3 | 4 | 5 | 10 | 25 | 35 | 50 | 100 | 500 | |
| Coin Toss | 2.00 | 2.00 | 2.00 | 2.00 | 2.00 | 2.00 | 2.00 | 2.00 | 2.00 | 2.00 | 2.00 | |
| roulette | 38.00 | 19.25 | 13.01 | 9.88 | 8.01 | 4.27 | 2.50 | 2.54 | 2.45 | 2.54 | 5.83 | |
| craps | 2.03 | 2.06 | 2.09 | 2.12 | 2.15 | 2.33 | 3.03 | 3.69 | 5.11 | 17.92 | 1387402.17 | |
| blackjack | 2.16 | 2.34 | 2.55 | 2.79 | 3.07 | 5.30 | 39.34 | 165.85 | 1470.83 | 2160401.10 | 47062061171619095023150304329728.00 |
Please, just look at that number for blackjack. It's ridiculous. One literally has a better chance of winning back to back lottery jackpots than double their money at blackjack from $500 to $1,000 using $1 bets.
Of course (see, I told you there was always an of course), and it might not seem so at first, but doubling one's bankroll turns the goal into a moving target, because with a $20 bankroll one only has to win $20, but with a $500 bankroll one has to win $500. So in some sense, we're not really comparing apples to apples.
So, in an effort to level the playing field, let's look at what happens if someone just wants to increase their bankroll by a mere $25, given that they start with $X.
Gambler's Ruin Chance of Increasing Bankroll by $25
| +$25 Odds 1 in | 1 | 2 | 3 | 4 | 5 | 10 | 25 | 35 | 50 | 100 | 500 | |
| Coin Toss | 26.00 | 13.50 | 9.33 | 7.25 | 6.00 | 3.50 | 2.00 | 1.71 | 1.50 | 1.25 | 1.05 | |
| roulette | 38.00 | 19.25 | 13.01 | 9.88 | 8.01 | 4.27 | 2.50 | 2.10 | 1.79 | 1.43 | 1.15 | |
| craps | 37.87 | 19.69 | 13.64 | 10.61 | 8.80 | 5.17 | 3.03 | 2.64 | 2.36 | 2.09 | 2.03 | |
| blackjack | 276.11 | 148.57 | 106.36 | 85.47 | 73.12 | 49.65 | 39.34 | 38.57 | 38.36 | 38.34 | 38.34 |
Lower is better in odds. So, what's really interesting about the above chart is that roulette, which is often considered to be an inferior game to both craps and blackjack (because the single game odds are worse -- i.e. the 'House Advantage' is greater), comes out ahead (provides the player with better odds) once one is going for some degree of profit. This is because roulette's pay off is greater; and so, one has to play fewer games to make the same degree of profit; which means, the House Edge has less time to take effect.
But you know what they say, sometimes a picture is worth a thousand words and/or ten thousand table entries.
Gambler's Ruin Chance of Doubling Bankroll
$1 - $10
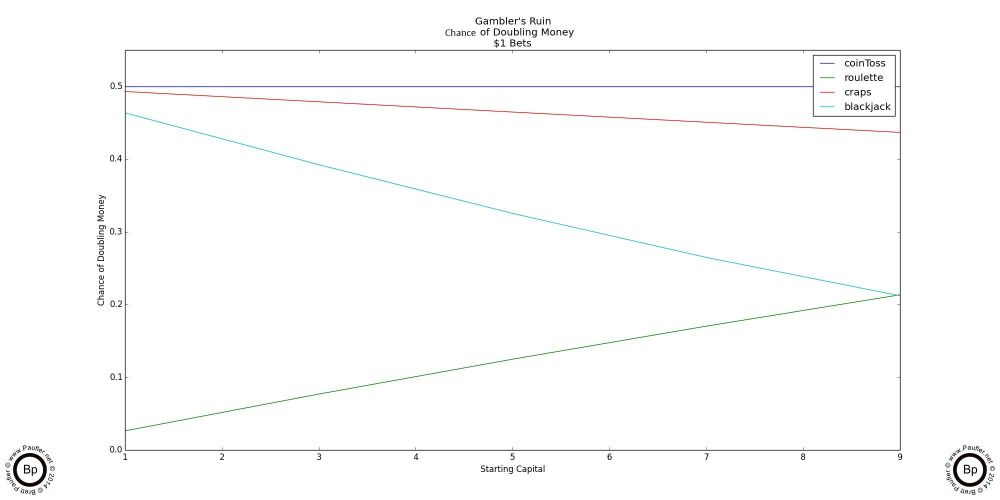
The above chart shows the simplistic analysis (a low number of wagering instances: i.e. the bet once and never again strategy). Notice how craps shines. It's right up there with Coin Toss (our 'Fair Odds' comparison). Without a doubt, if all one wanted to do was win a handful of bets (or make a handful of wagers), craps is the way to go.
Gambler's Ruin Chance of Doubling Bankroll
$1 - $50 & $1 - $250
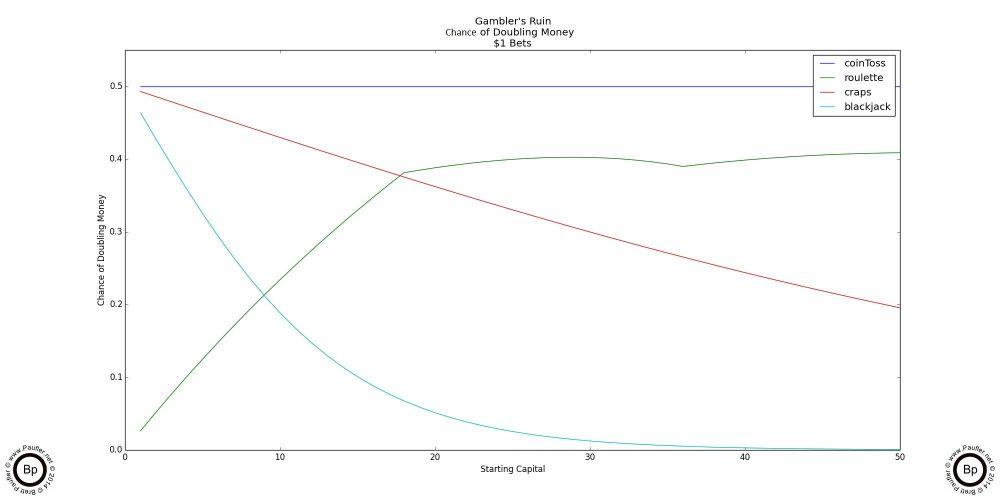
But I don't know anyone who gambles just to make a buck or two. And the above two graphs show how quickly roulette crosses over and becomes the superior betting strategy to either craps or blackjack if any significant degree of gambling is going to be done.
Please note the 'bump and skips' for roulette's as the amount won jumps over the amount roulette pays off. Since roulette pays off at 35 to 1, certain prize amounts are easier to achieve. Or that is to say, whether one starts with $1 or $18, if the goal is to double one's money, then this translates into a single win (which pays 35 to 1 and so satisfies the winning objective for any amount $18), so the more one starts with, the greater the chance this will happen.
I don't know if that's clear or not, but it's really not that important. Let's just say, I'm not surprised by a hump in the roulette data, but I would be suprised to see one in the craps data.
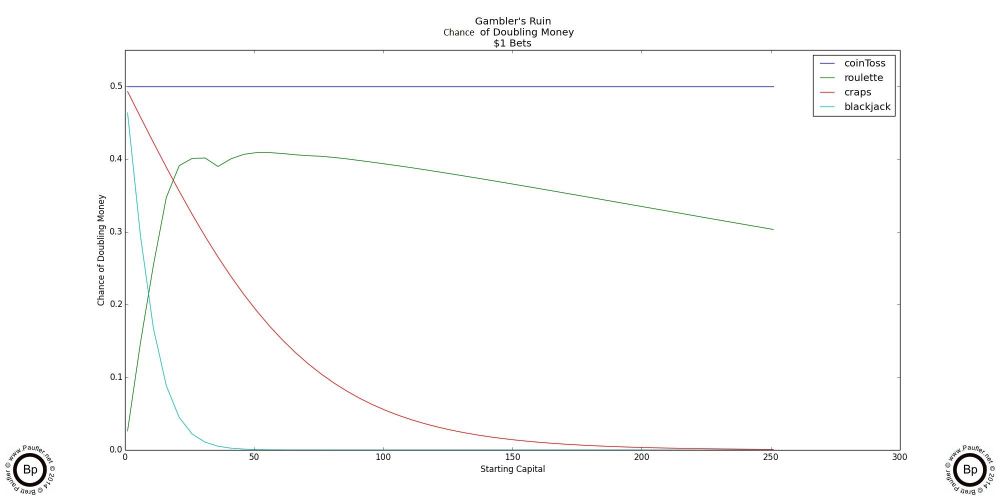
Moving on to the range $100-$500, the superiority of roulette over craps or blackjack becomes astonishingly clear.
Gambler's Ruin Chance of Doubling Bankroll
$100 - $500
Like I said, this last graph is the real kicker. Very quickly, the chance of merely doubling one's bankroll tends towards zero as the number of wins required increases.
Yes. True. The chance of doubling one's money from $500 to $1000 in roulette is low, but there's still exists some real world chance. In craps, it's minimal. In blackjack, it's simply non-existent. And as the prize level goes up (the amount one is trying to win) the chance only gets worse.
Actually, I would have liked to extend the graphs out a bit further (say to $5,000 or so). But the computations involved take a long-long time (easily longer than 30min for the two last entries in the chart below and that's just for a single number, let alone how many point-samples a graph requires). And then, let's be honest. I'm a modern type guy. I simply don't have the patience for my slow poke computer to spit out a graph if it's going to take more than a few seconds.
Gambler's Ruin for Roulette
| $ Start | $ Finish | Chance (p) | Odds (1/p) |
| $1 | $1,000 | 0.0001453111349 | 6881 |
| $10 | $1,000 | 0.0014733204939 | 679 |
| $1 | $1,500 | 0.0000303279616 | 32,973 |
| $10 | $1,500 | 0.0003074974774 | 3,252 |
| $1 | $2,000 | 0.0000065143704 | 153,506 |
| $10 | $2,000 | 0.0000660496909 | 15,140 |
Please notice that the increase in the odds against (being the same as the decrease in chance of winning) increases far more between $1,500 & $2,000, than between $1,000 & $1,500. This means the change is exponential. I haven't crunched the numbers (and I'm not going to), but I think it's a safe bet that one would be more likely to win back to back lottery jackpots than increasing a $1 bankroll to $10,000 at roulette.
But even with the data we have, it's clear that the California Lottery offers substantially higher prize levels for the same odds (the same risk) if one's goal is to increase their bankroll by $1,000 or more. The odds of winning the Daily 4 are 1 in 10,000 with an average payout (it's parimutuel, so the payout is a moving target) of 5,000 for 1 (and that's for a $1 ticket). In the chart above for roulette, the odds of a winning a $2,000 payout are 1 in 153,506 (so that's less than half the money for 15x the risk). The lottery clobbers roulette. And roulette clobbers craps. It's conditional (for prize levels in excess of $1,000). But the progression is clear. If one wants to win a million dollars, the lottery is the way to go. Hands down. Case closed. No questions about it. Traditional table games don't come close to comparing.
Please Note: Slot machines may have comparable outcomes to the lottery, but the last time I looked (which was a long time ago) slot machines did not come with complete odds charts; and until they do, I will consider them a sucker's bet. Certainly, I do not take them as a serious alternative to the lottery.
Also Note: In the above, if we divide the Odds of Winning with a $1 bankroll by 10, we arrive at a number fairly close to the odds of winning with a $10 bankroll. There is a difference, but the derived odds from using such a mechanism are in the same magnitude of range as using the exact computations. Thus to simplify matters in the sections that follow, I will assume that a $10 bet and ten $1 bets are in fact equivalent. They are not, but the magnitude of difference just isn't enough for me to worry about. And since the purpose of this page isn't mathematical purity but to simply determine which gambling wager is the best, the difference will be equal over all games and not effect our conclusions in any way.
Thus and in conclusion, in this section I have demonstrated that if one wishes to win a substantial sum of money (any amount over $1,000, or so), the lottery IS the best bet around. And for the serious gambler, the only game in town.
As we saw in the previous section, when one wishes to increase their bankroll by a factor of 1000 or more, the California Lottery offers better odds (better prizes at lower risk) than any of the standard casino table games.
But not all California Lottery Games are created equal. As follows is a chart listing all of the California Lottery Games considered on this page (all that were in play as of 7-12-14) noting their: game #, name, chance of winning ANY prize, and the odds of same (odds equals 1/chance).
Note: the odds are tabulated by combining the odds for each individual prize level as indicated on the lottery website, which means the tabulations rely on incomplete information (the number of tickets in a scratchers game is never stated; or at least, I couldn't find it). Thus, there may be inconsistencies between the actual odds, the lottery's stated odds, and my computations. I believe the level of these inconsistencies are so small as to be trivially unimportant, but with incomplete information comes uncertainty.
Also, as discussed above, the difference between five $1 tickets and one $5 ticket is not important when the odds become high enough and the number of tickets bought becomes low enough (meaning any reasonable betting level). Thus to make the charts easy to compare (and the computations easier to do), the odds for a $2 ticket are doubled, $5-5x, $10-10x, and so on. In other words, from here on down, ALL ODDS ARE NORMALIZED to a $1 ticket. Thus, since the Power Ball is a $2 ticket, the actual odds are twice as good per ticket. But if we left the Power Ball odds alone, we would be in a postion of having to compare one Power Ball ticket against two $1 Super Lotto tickets. And it's simply easier (computationally, conceptually) to simply normalize everything to $1.
Chance (p) & Odds (1/p)
of Winning Any Prize in the California Lottery
(normalized to $1)
| Name | Game | Chance Any Prize | Odds (1:X against) |
| Power Ball | Power Ball | 0.0157604156 | 1: 63.450104 |
| Mega Millions | Mega Millions | 0.0690094587 | 1: 14.490767 |
| Super Lotto | Super Lotto | 0.0424426270 | 1: 23.561218 |
| fantasy5 | fantasy5 | 0.1100057212 | 1: 9.090436 |
| dailyDerby | dailyDerby | 0.0421998090 | 1: 23.696790 |
| daily3 | daily3 | 0.0010000000 | 1: 1000.000000 |
| daily4 | daily4 | 0.0001000000 | 1: 10000.000000 |
| s800 | california-lucky-for-life-800 | 0.2210957431 | 1: 4.522927 |
| s831 | california-lucky-for-life-831 | 0.1119849775 | 1: 8.929769 |
| s832 | california-lucky-for-life-832 | 0.0578543258 | 1: 17.284792 |
| s833 | california-lucky-for-life-833 | 0.0284789877 | 1: 35.113608 |
| s836 | tripling-crossword-836 | 0.1003085170 | 1: 9.969243 |
| s847 | 20x-crossword-847 | 0.0294724679 | 1: 33.929972 |
| s850 | tripling-crossword-850 | 0.1003085170 | 1: 9.969243 |
| s851 | 75000-poker-851 | 0.0557683262 | 1: 17.931325 |
| s863 | big-6-bingo-863 | 0.0596851176 | 1: 16.754595 |
| s865 | 5x-crossword-865 | 0.0998136818 | 1: 10.018667 |
| s867 | california-gold-867 | 0.0285367895 | 1: 35.042484 |
| s1100 | %245-million-jackpot-1100 | 0.0169577558 | 1: 58.970067 |
| s1104 | silver-7s-1104 | 0.0580410589 | 1: 17.229183 |
| s1106 | chocolate-1106 | 0.1127124336 | 1: 8.872136 |
| s1107 | tripling-crossword-1107 | 0.1003085170 | 1: 9.969243 |
| s1108 | 20x-the-money-1108 | 0.0538934937 | 1: 18.555115 |
| s1109 | electric-8s-1109 | 0.2127678807 | 1: 4.699958 |
| s1110 | money-roll-1110 | 0.1171843037 | 1: 8.533566 |
| s1111 | mega-crossword-1111 | 0.0526767038 | 1: 18.983724 |
| s1112 | ca-black-exclusive-1112 | 0.0300000102 | 1: 33.333322 |
| s1113 | rock-star-7s-1113 | 0.1154877379 | 1: 8.658928 |
| s1114 | bingo-twist-tripler-1114 | 0.0918436282 | 1: 10.888072 |
| s1115 | high-roller-poker-1115 | 0.0557683262 | 1: 17.931325 |
| s1116 | spicy-cash-1116 | 0.1217999283 | 1: 8.210185 |
| s1117 | lucky-stars-1117 | 0.0902535768 | 1: 11.079893 |
| s1118 | %24500-frenzy-1118 | 0.0460771062 | 1: 21.702752 |
| s1119 | bonus-crossword-1119 | 0.0294724679 | 1: 33.929972 |
| s1120 | california-lucky-life-1120 | 0.2210957431 | 1: 4.522927 |
| s1121 | california-lucky-life-1121 | 0.1119849775 | 1: 8.929769 |
| s1122 | california-lucky-life-1122 | 0.0543699530 | 1: 18.392512 |
| s1123 | california-lucky-life-1123 | 0.0280174592 | 1: 35.692030 |
| s1124 | piggy-bank-1124 | 0.2078969546 | 1: 4.810075 |
| s1125 | 5x-crossword-1125 | 0.0998136818 | 1: 10.018667 |
| s1126 | triple-777-1126 | 0.0580410589 | 1: 17.229183 |
| s1127 | wheel-of-fortune-1127 | 0.1166521300 | 1: 8.572497 |
| s1128 | wheel-of-fortune-1128 | 0.0555095069 | 1: 18.014932 |
| s1129 | wheel-of-fortune-1129 | 0.0283909856 | 1: 35.222448 |
Rather boring stuff; but then, raw data usually is.
Anyhow, I'm guessing you just zipped through that last (scrolled down as fast as you could; or at least, I would have). And if one were to scroll down just a bit more, one might find (maybe, probably, can't really guarantee it, individual results may vary, etc.) graphs that restate the above and then take the information quite a bit farther.
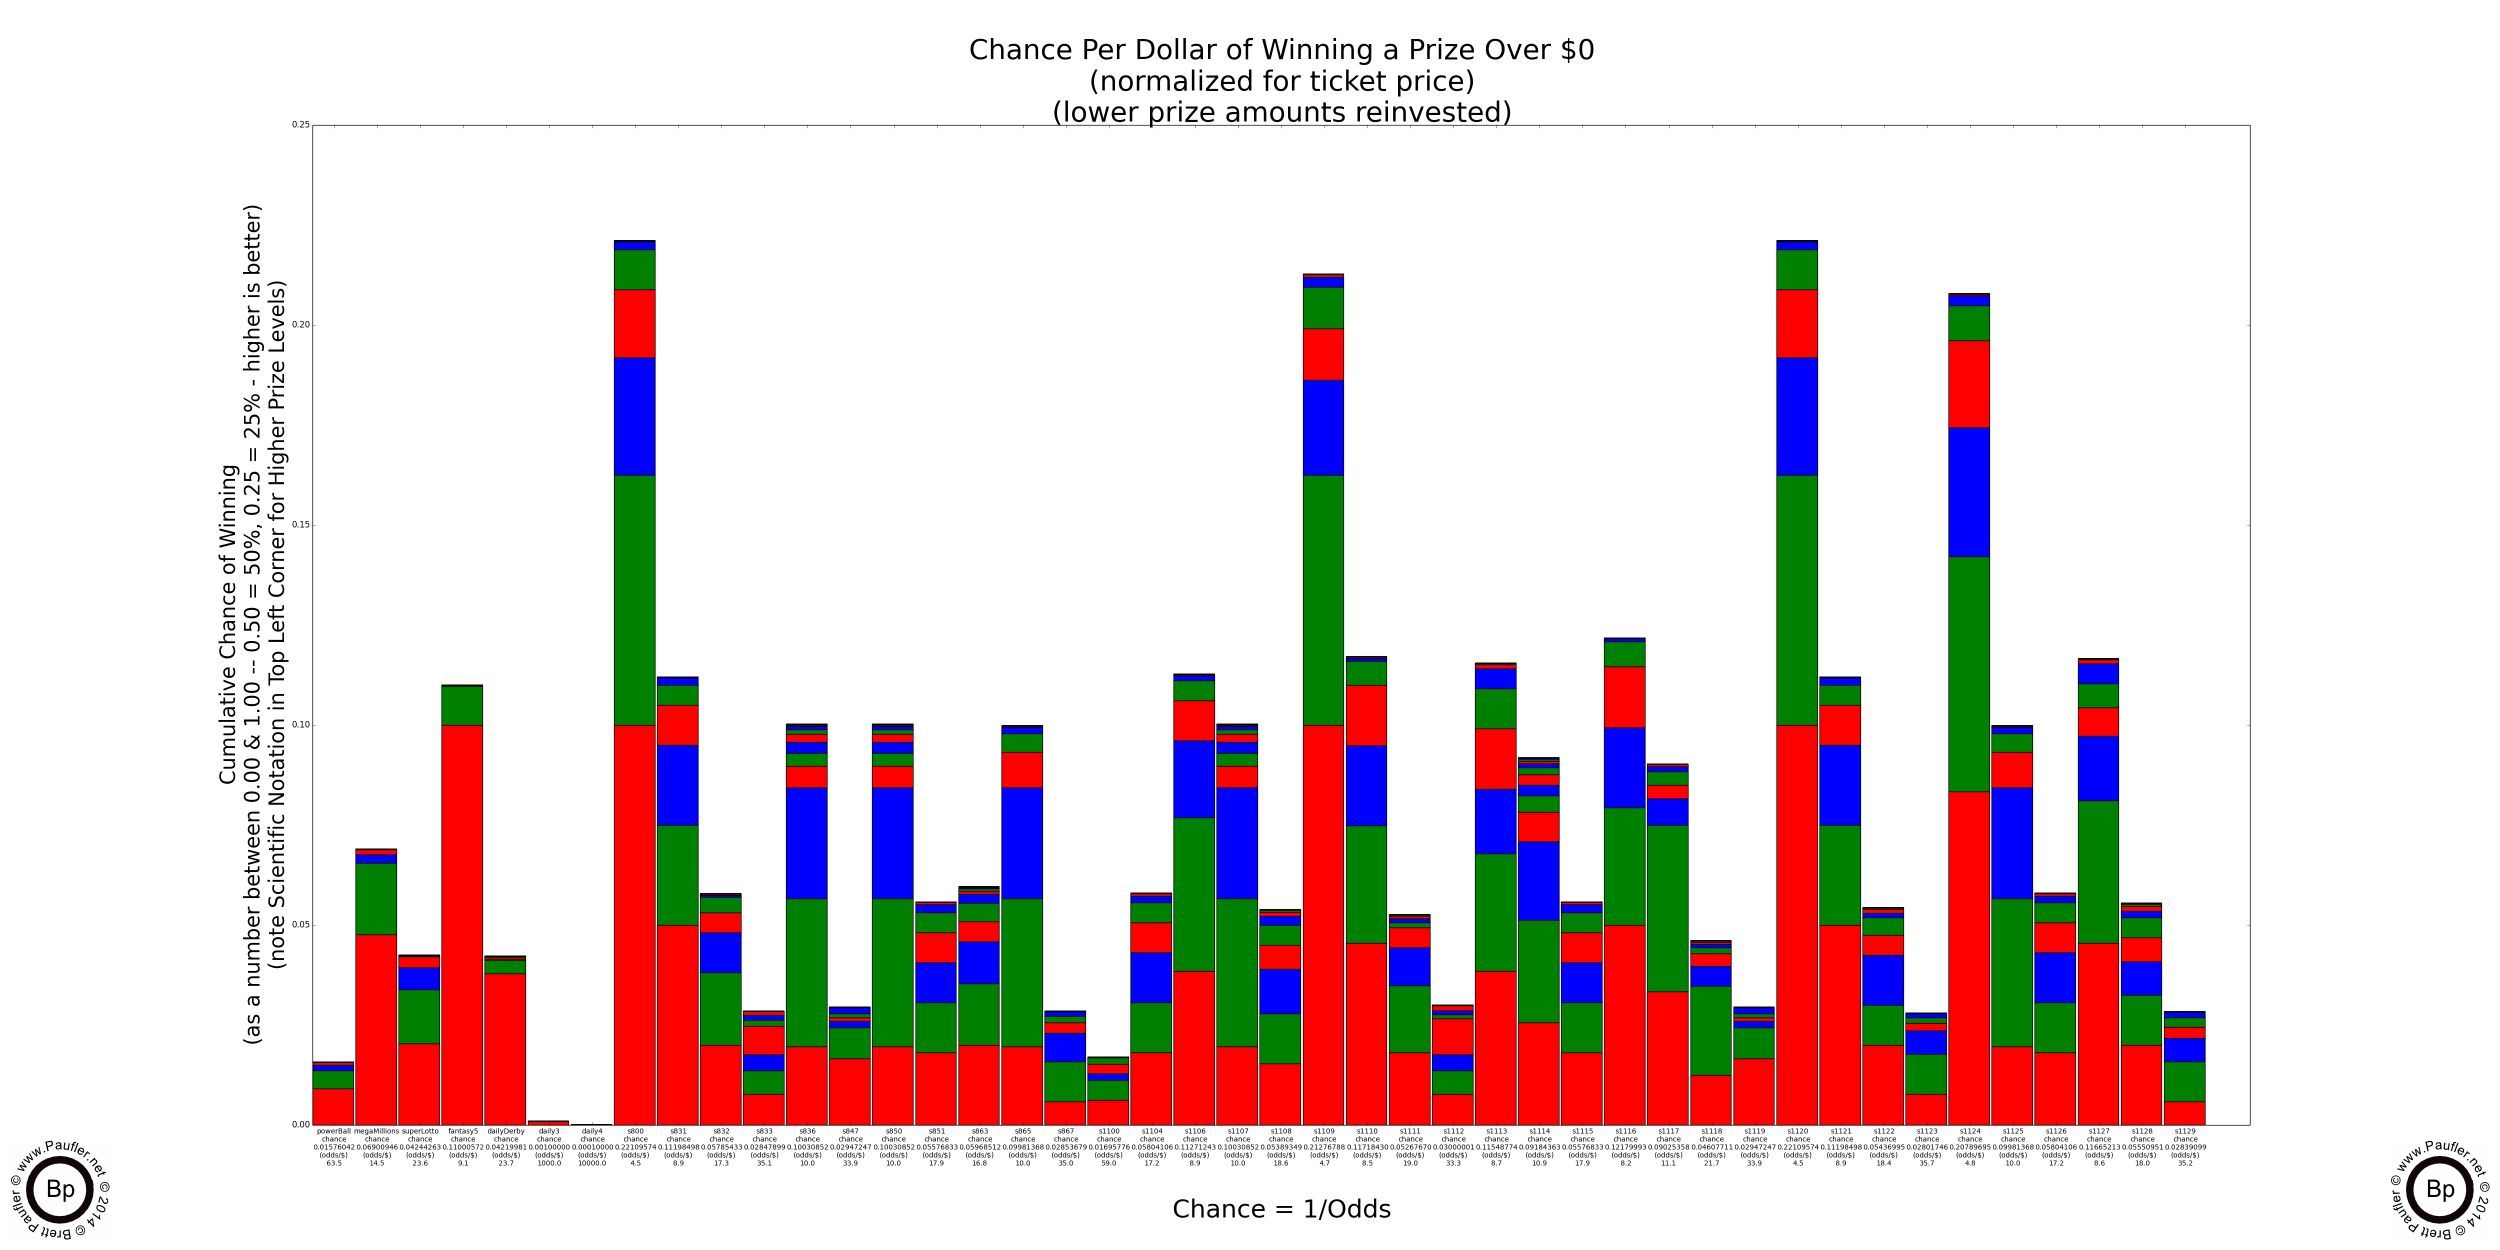
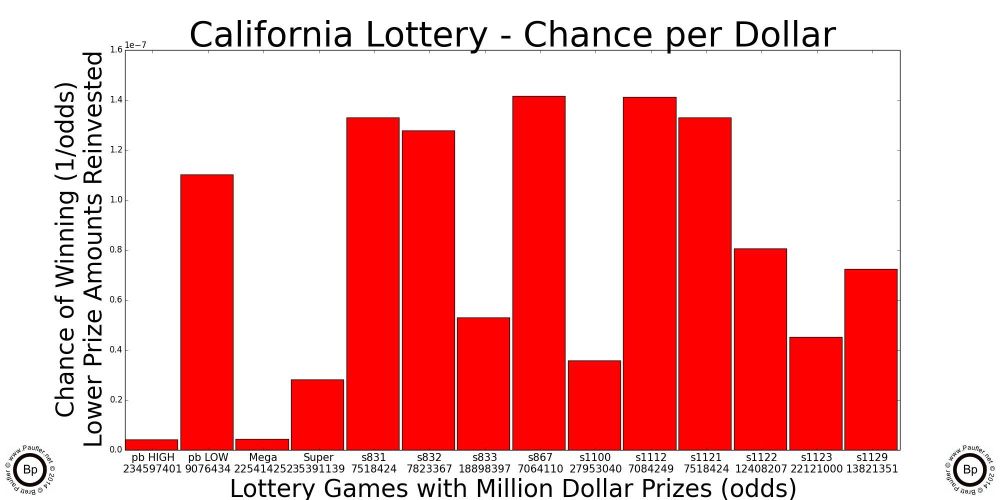
The graphs below are truly things of wonder (if I do say so myself).
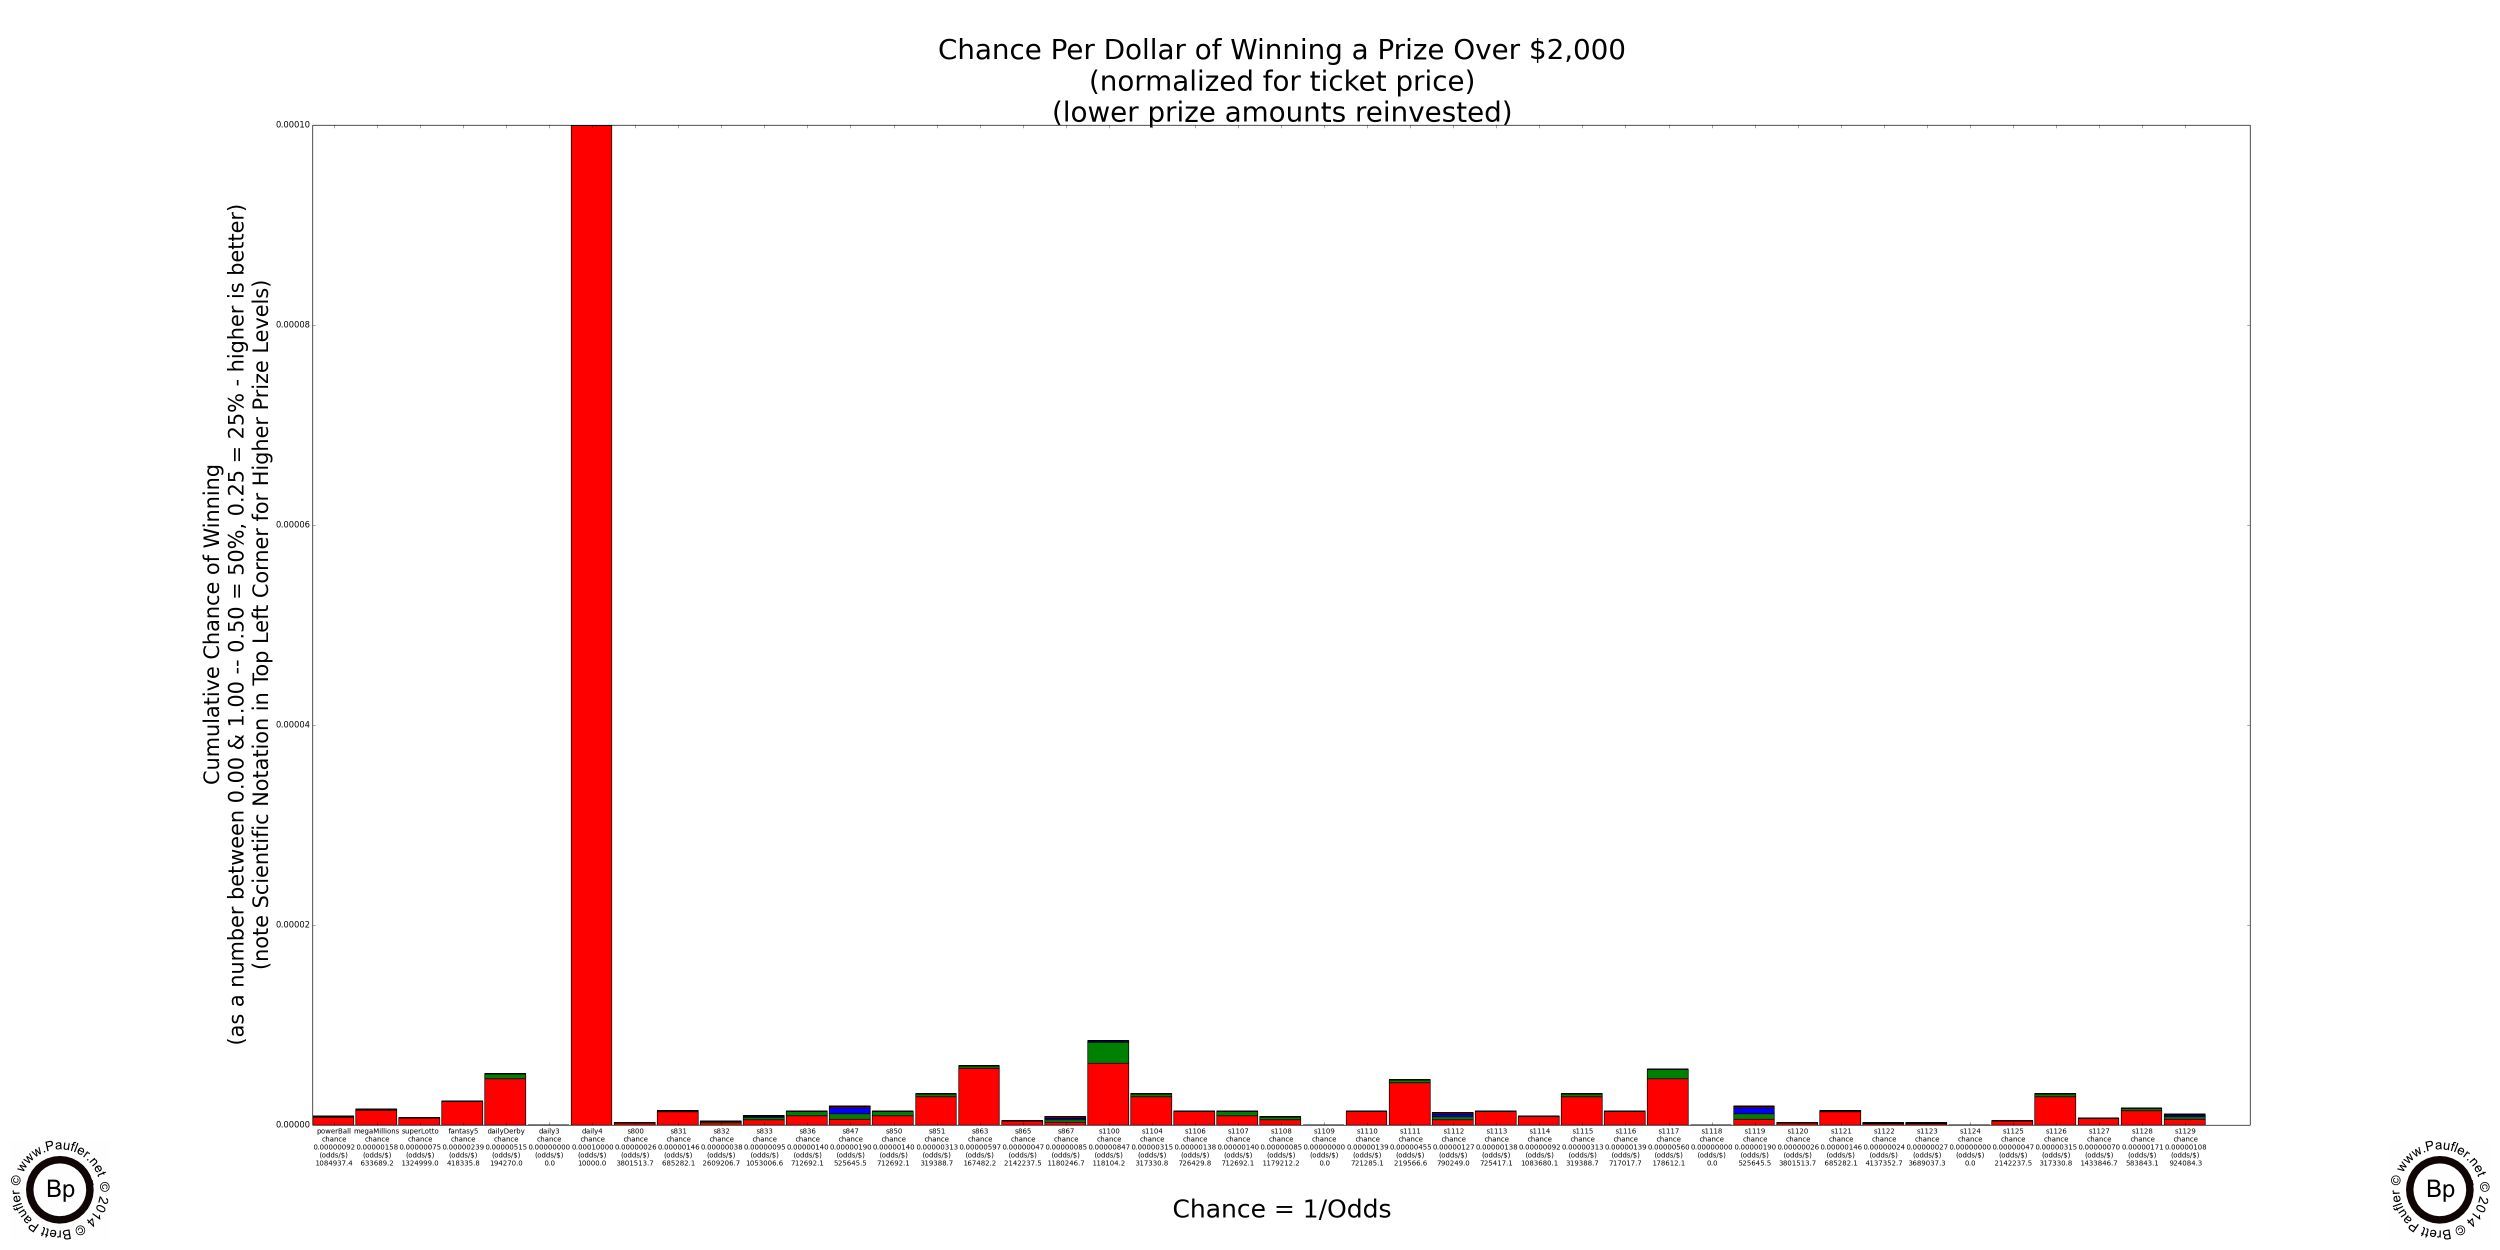
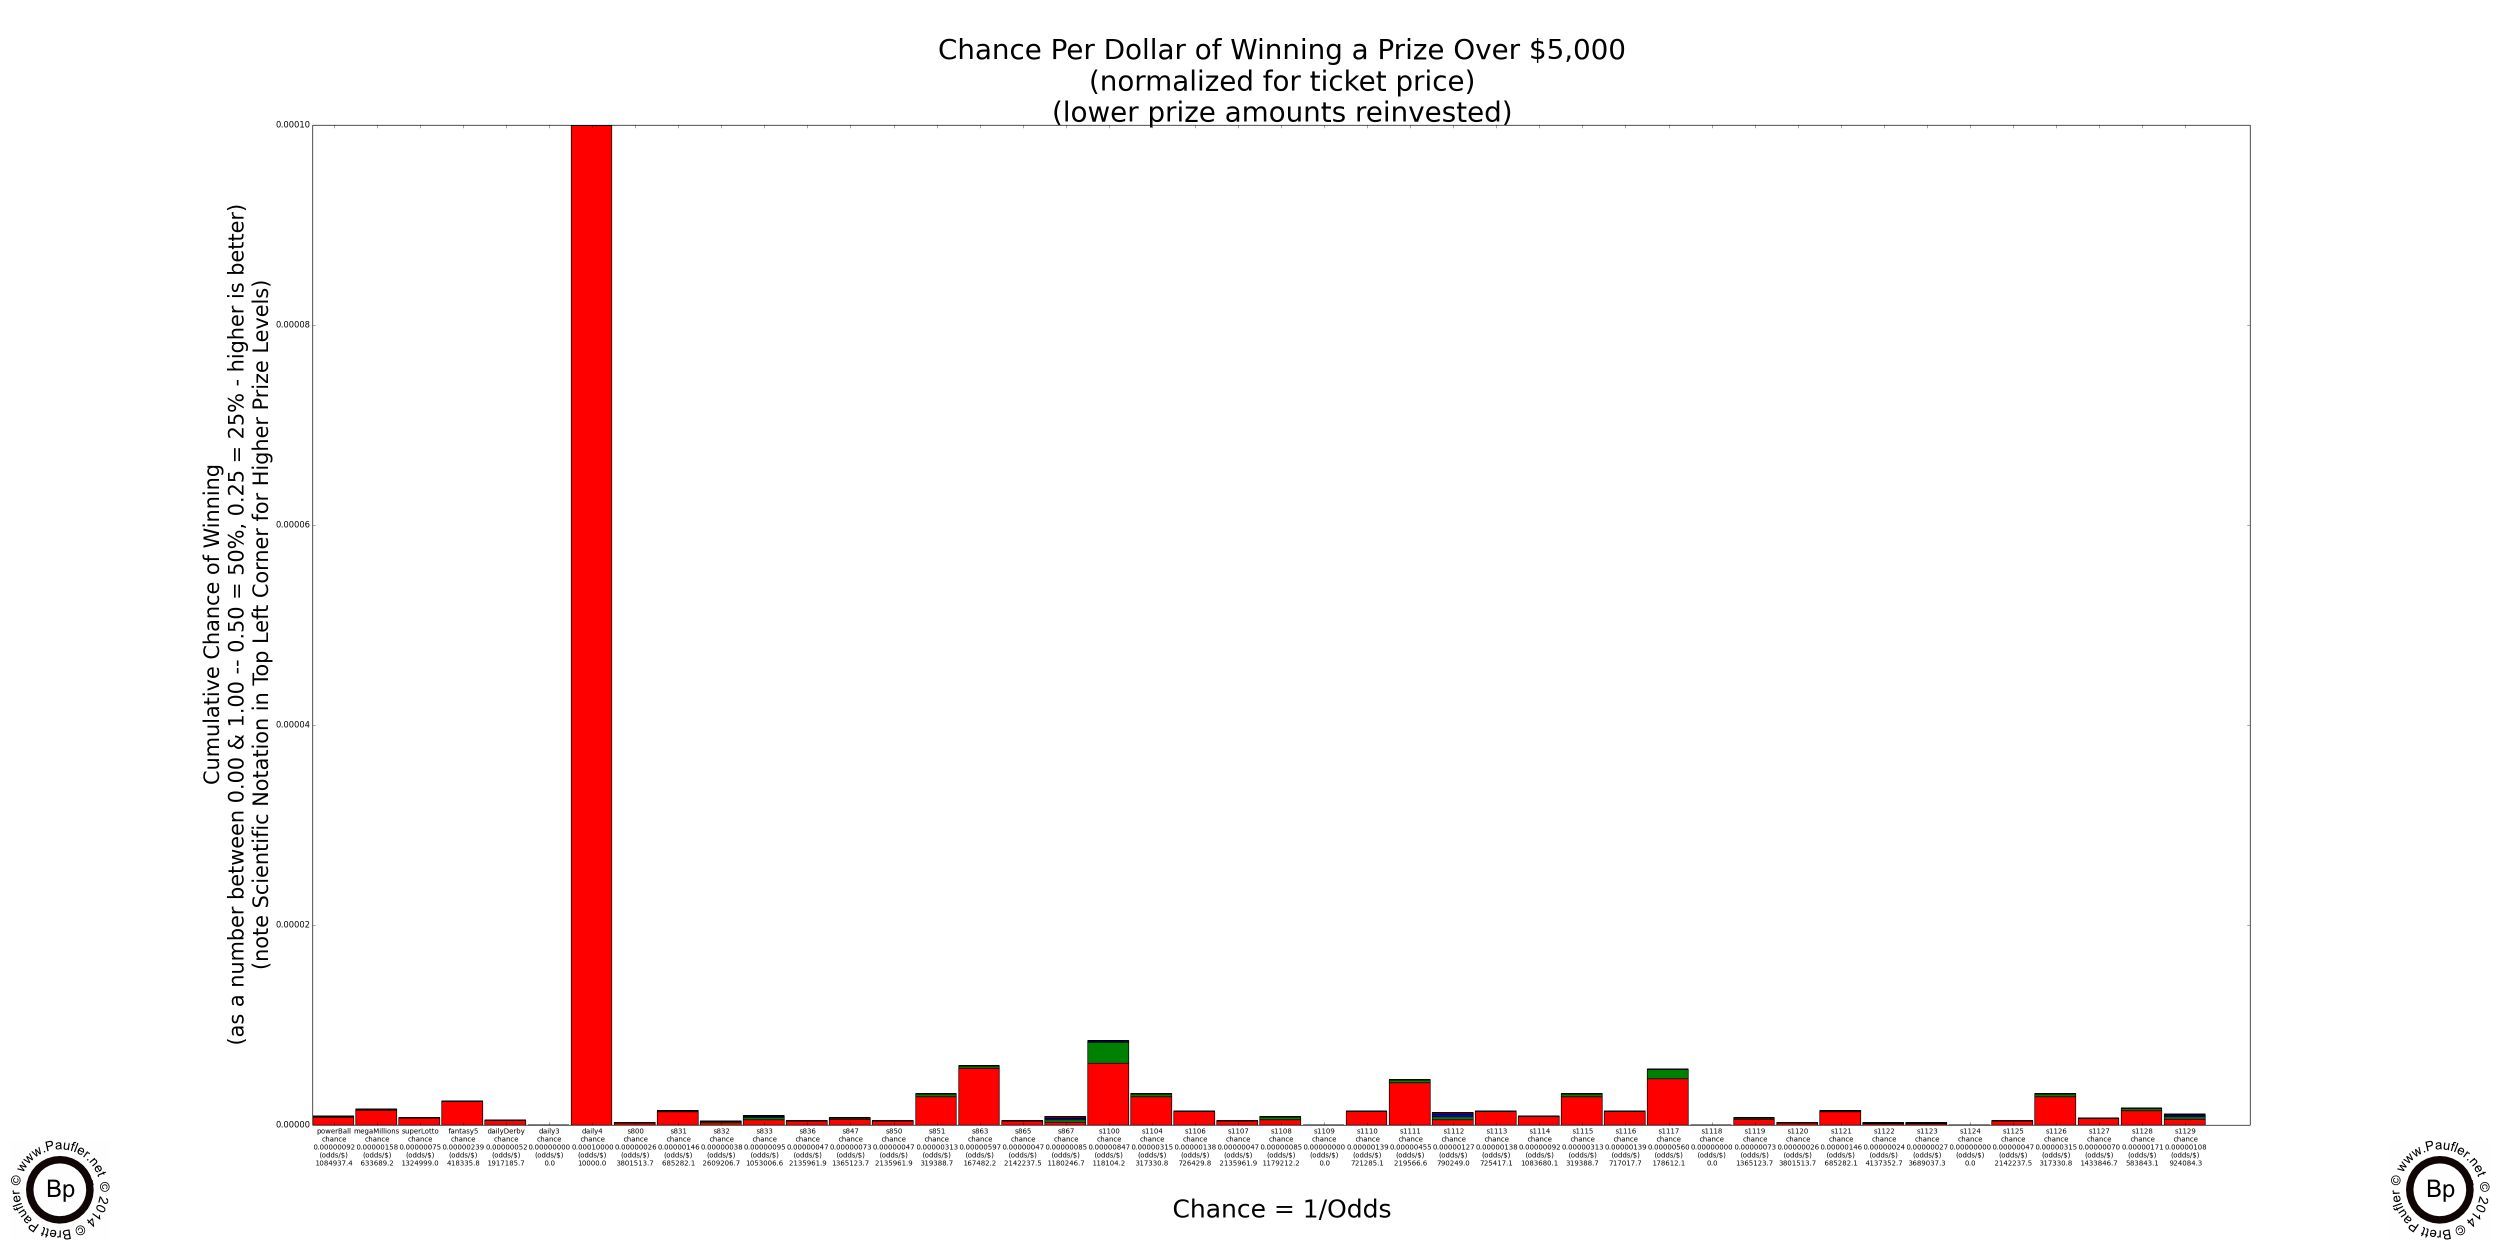
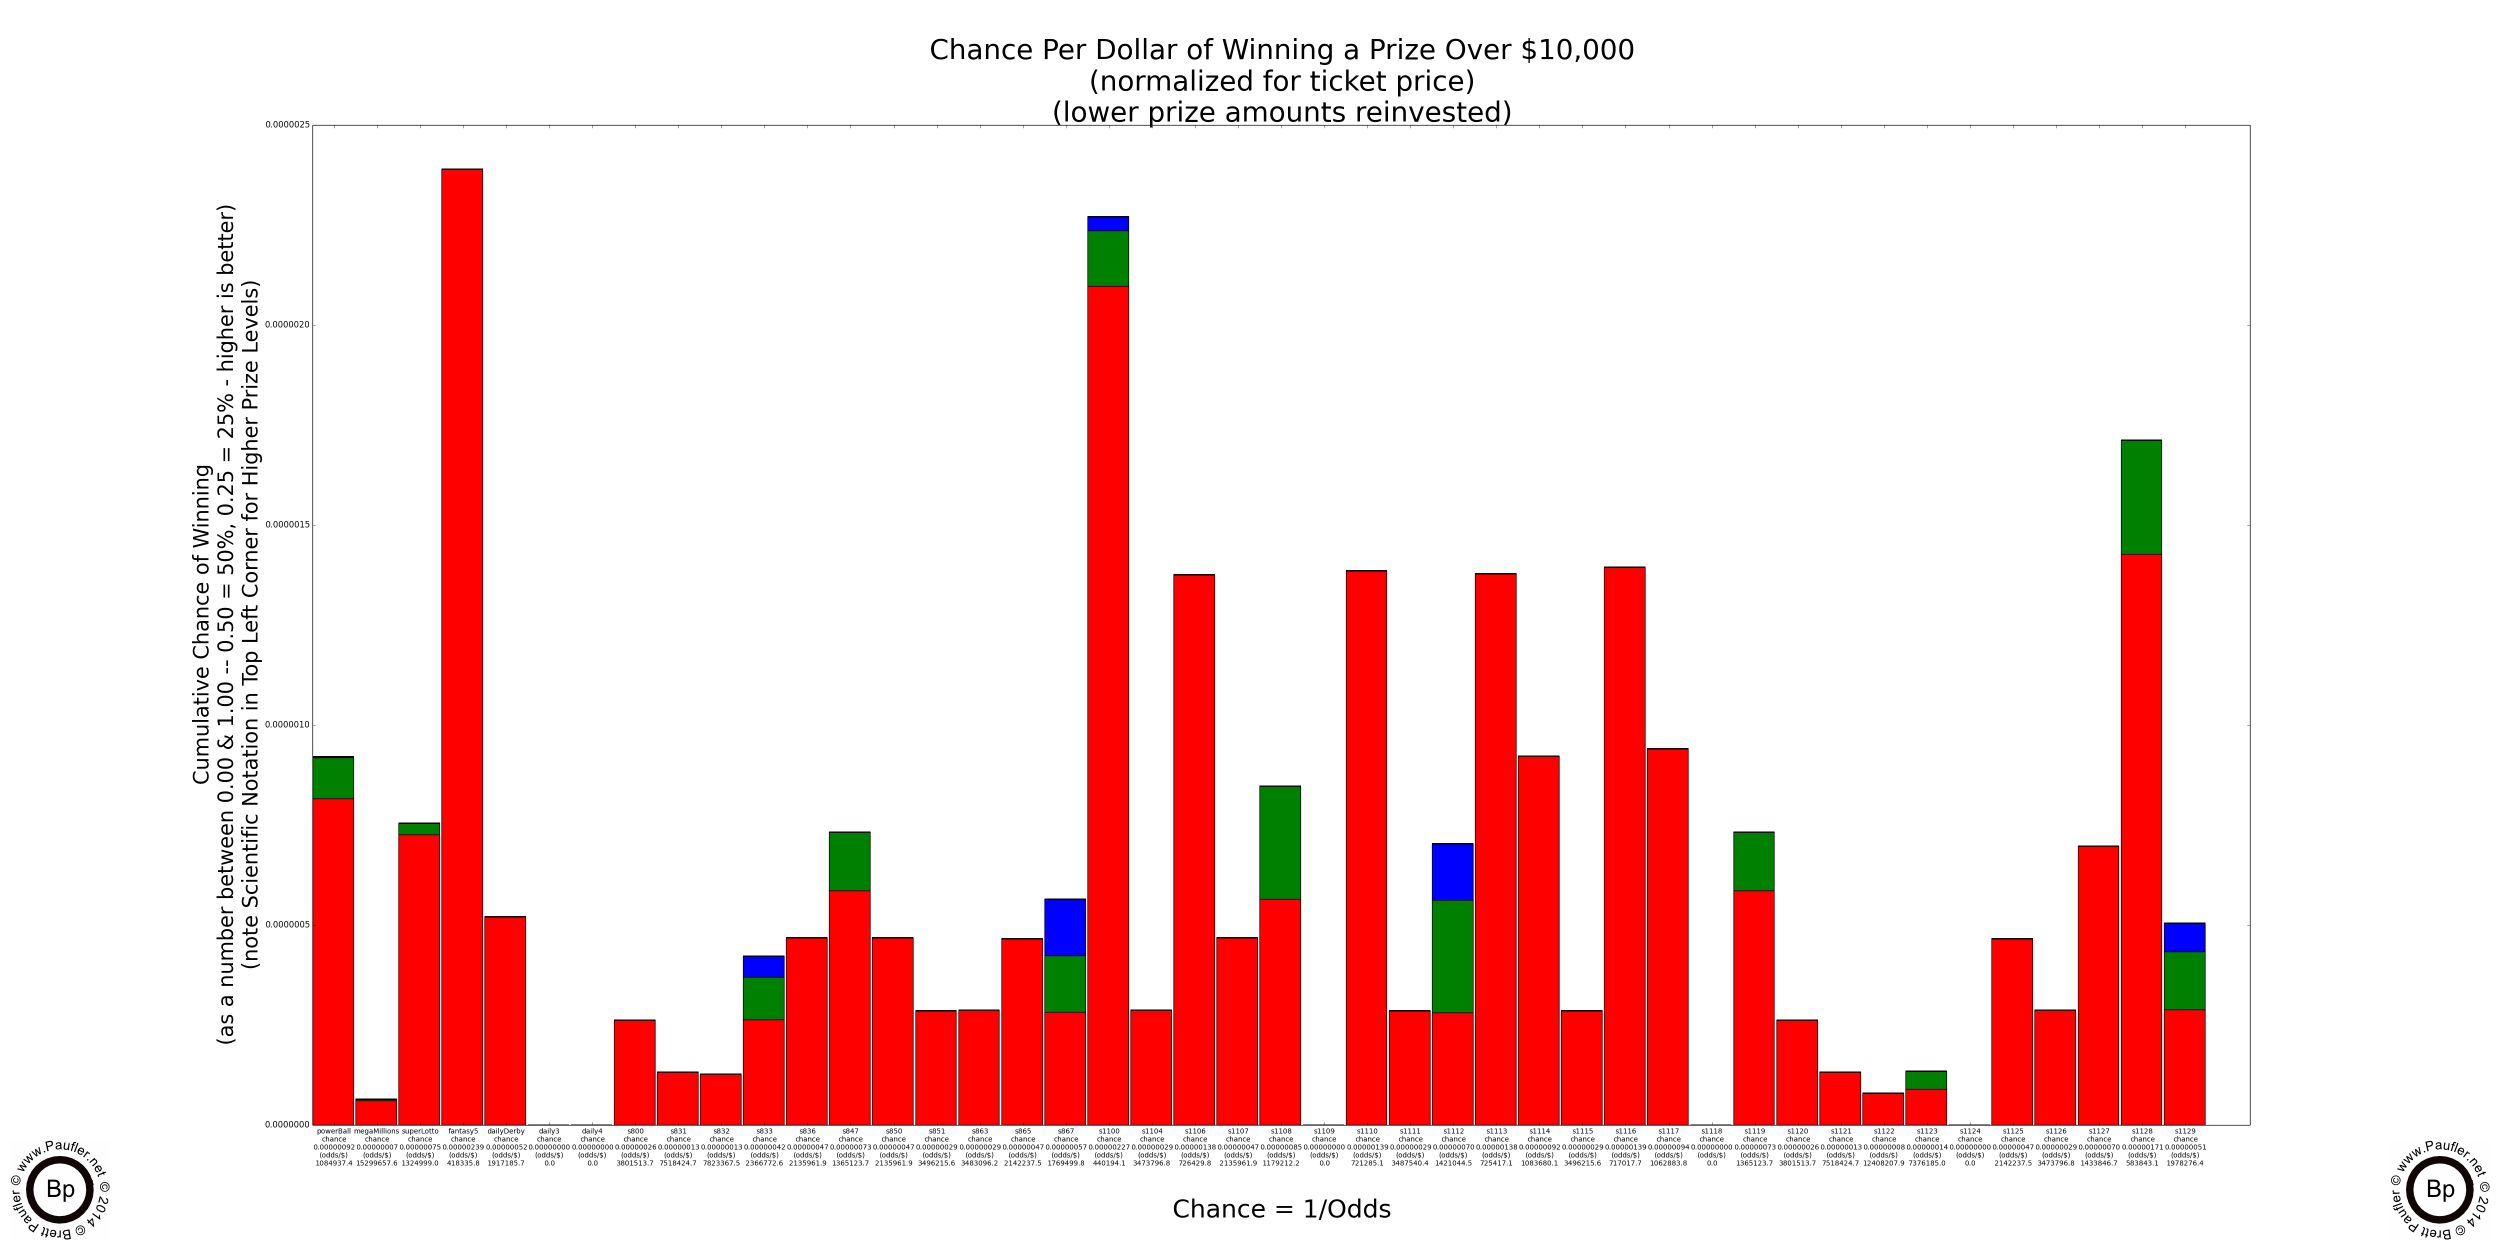
The different prizes levels are segregated by color with the top most prize in each bar representing the prize with the highest dollar amount, which means as a general rule that the lowest prize amount (the bottom bar in any vertical grouping) has the greatest relative chance of being won.
All values have been 'normalized' to $1 bets. That means the odds for a winning any Power Ball or $2 Scratcher prizes have been multiplied by 2 (which is the same as dividing their chance by two); all $5 Scratcher odds have been multiplied by 5; $10 by 10; and $20 by 20, giving us a even playing field from which to compare the various games.
Taller bars (those that extend further longer vertically) indicate better odds. And although all the bars are scaled appropriately within each graph, the different graphs have different scales to better contrast the differences between playing strategies. This becomes increasingly more important as we investigate the higher prize levels, because if we didn't selectively change the scale, all the bars would group on the bottom, as the chance for a million dollar prize is (remains and shall ever be) pretty darn close to 0.00. You do remember those tables regarding how many years of high level play it would take to have a reasonable chance of winning? Well, these graphs are for a single play with correspondingly lower chances.
The loaded images are quite large. And if the screen is enlarged enough, all the text (the exact chance and odds for each game as written below) becomes legible.
All of the games appear in the same order from graph to graph and are for all California Lottery Games as were in existence on July 11th, 2014. They appear from left to right on the graphs below as they are listed from top to bottom in the table above, which tabulates the results for the first graph: ANY Prize.
The graphs show the chance of winning any prize above the stated value with all prizes below the stated value 'reinvested' back into the game by buying additional tickets. This is probably pretty reasonable when the prizes involved are $5 and $10, less so when the prize is $100,000, but is done nonetheless for comparative purposes.
And here now, without further ado and/or qualifications and/or disclaimer (no results-interpretation-analysis guaranteed, use at your own risk, see bottom of page for further legal wishy-washy-ness) are the Base Chance Graphs for the California Lottery (with the lower prize amounts reinvested, as additional plays).
Lottery Odds Graphs
Winning Any Prize or $10 or More
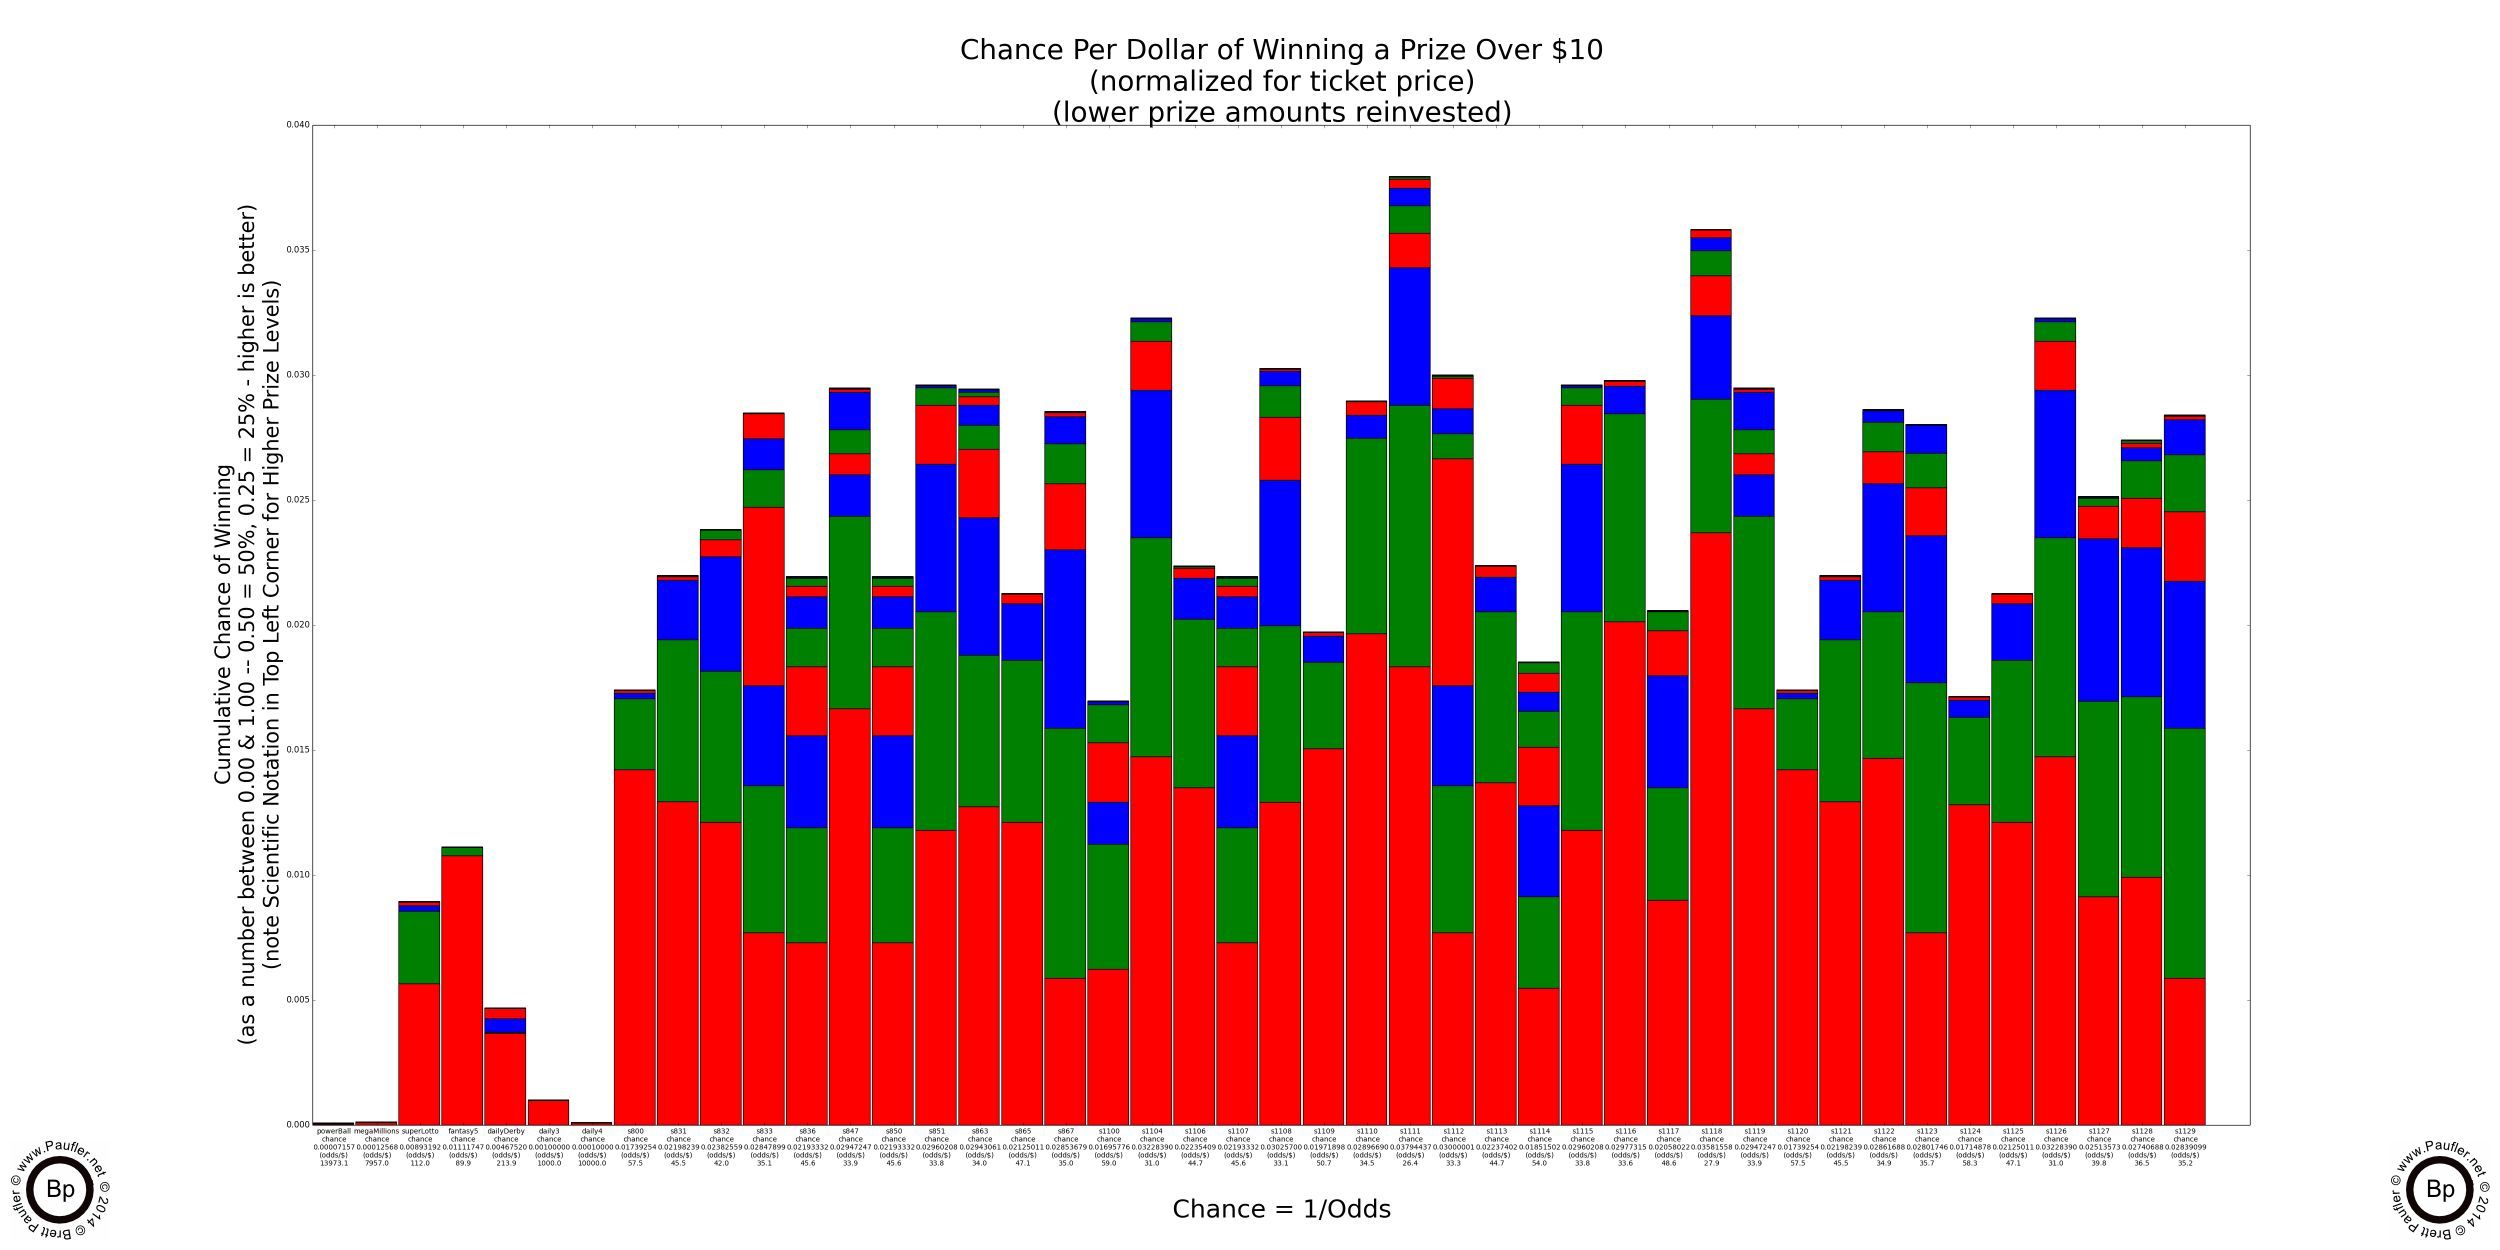
Lottery Odds Graphs
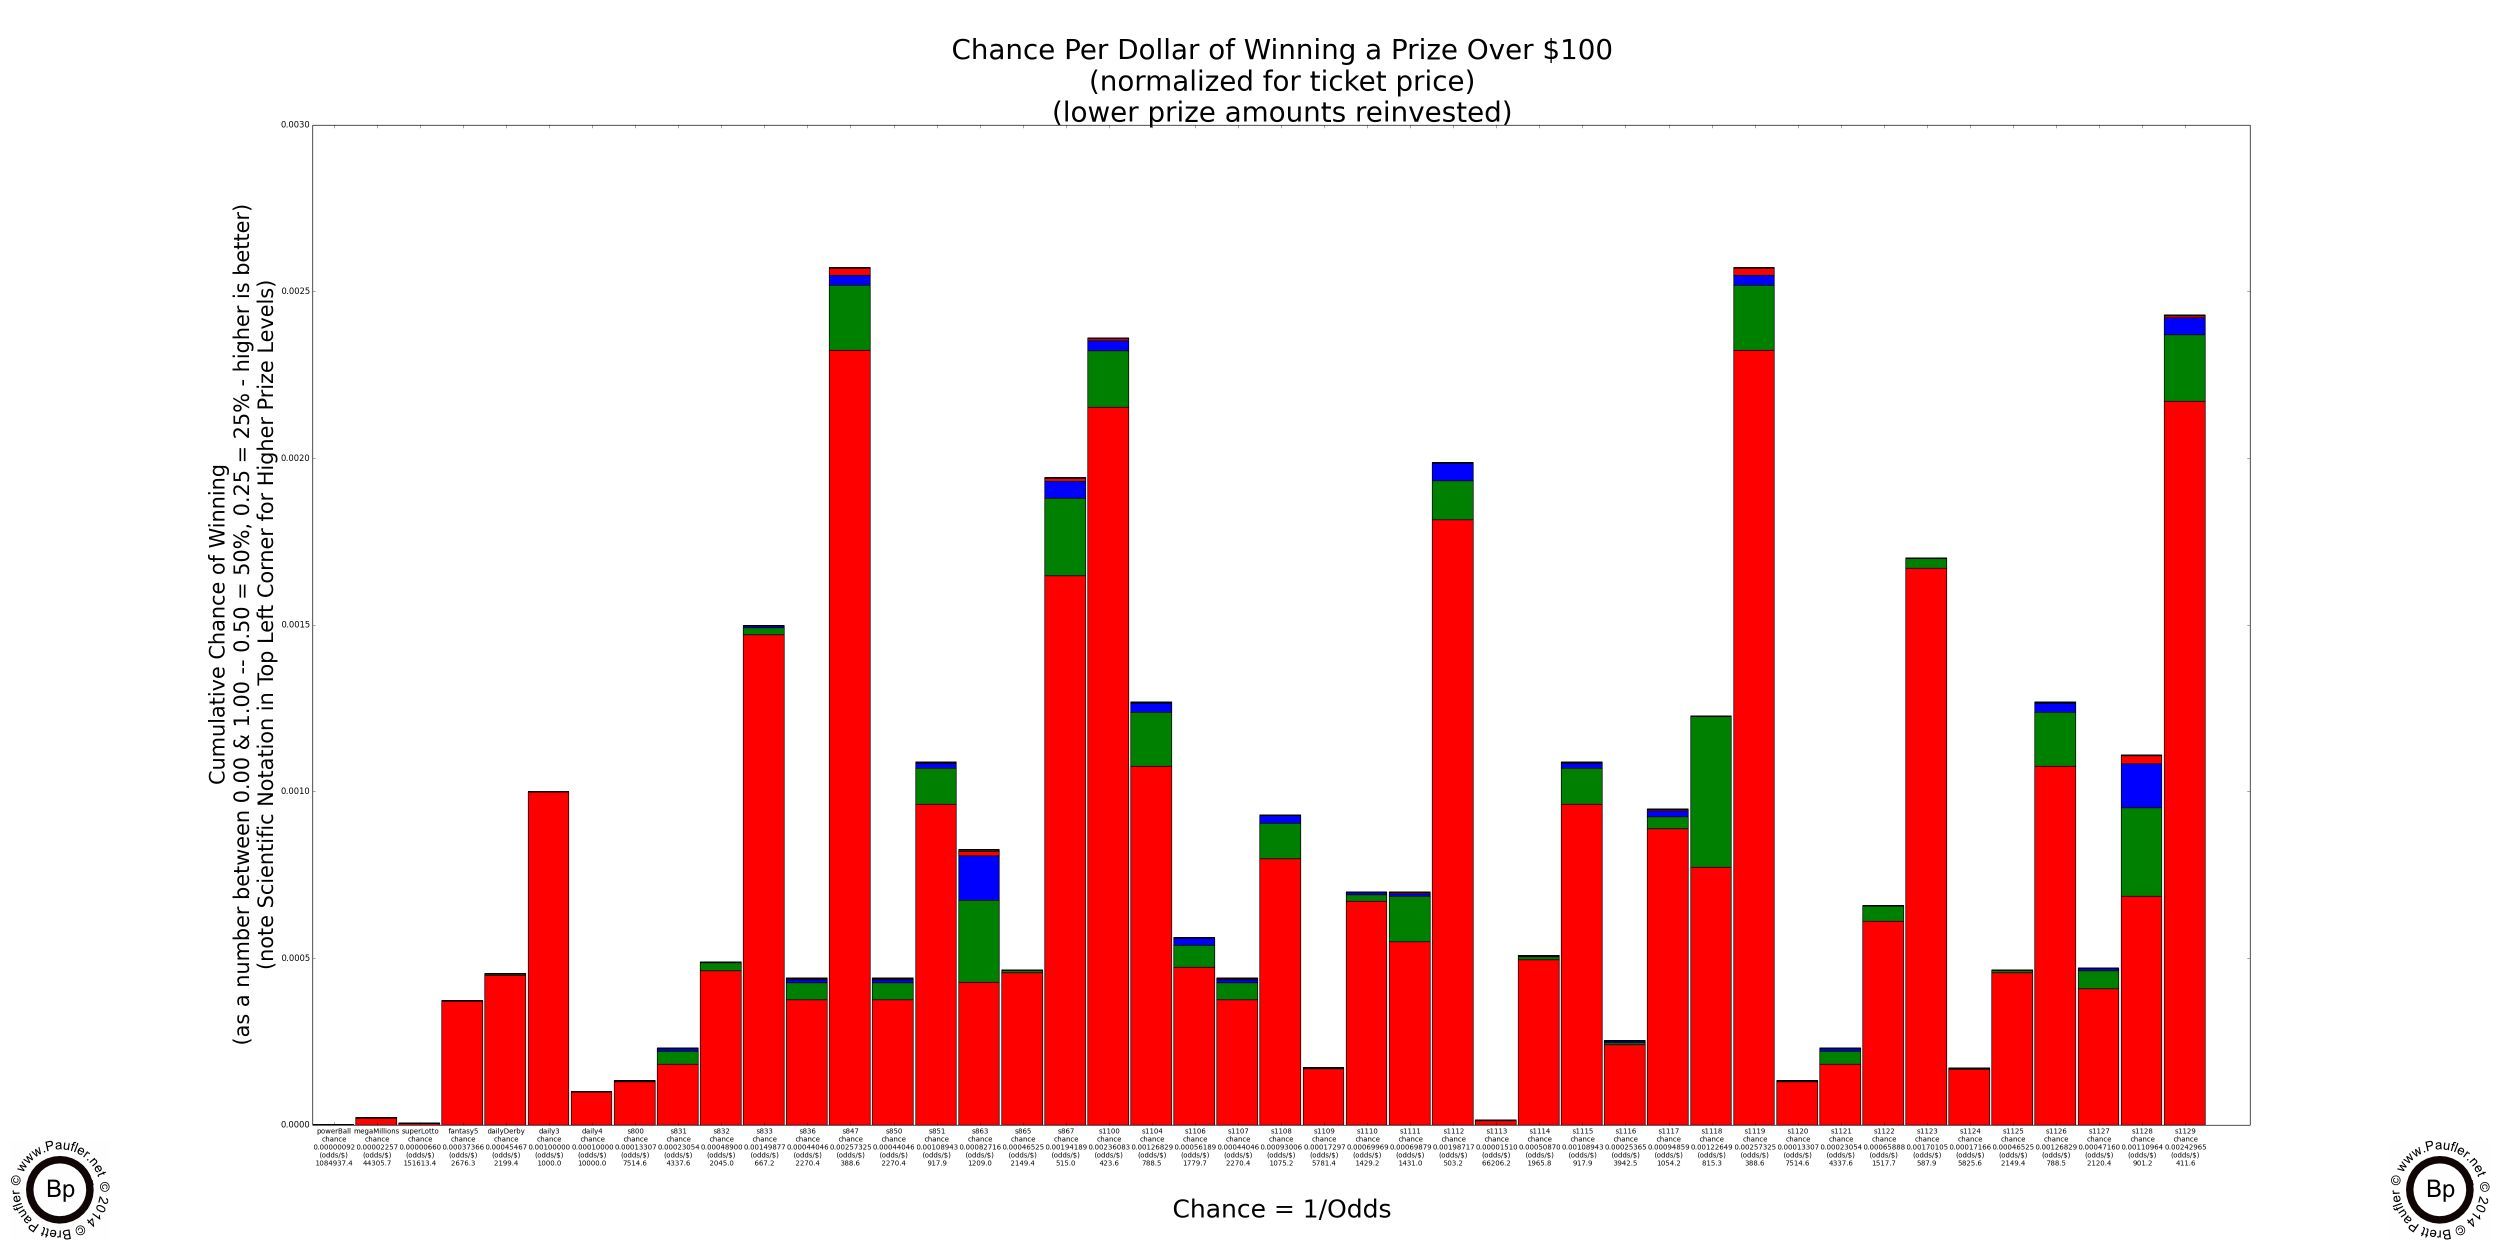
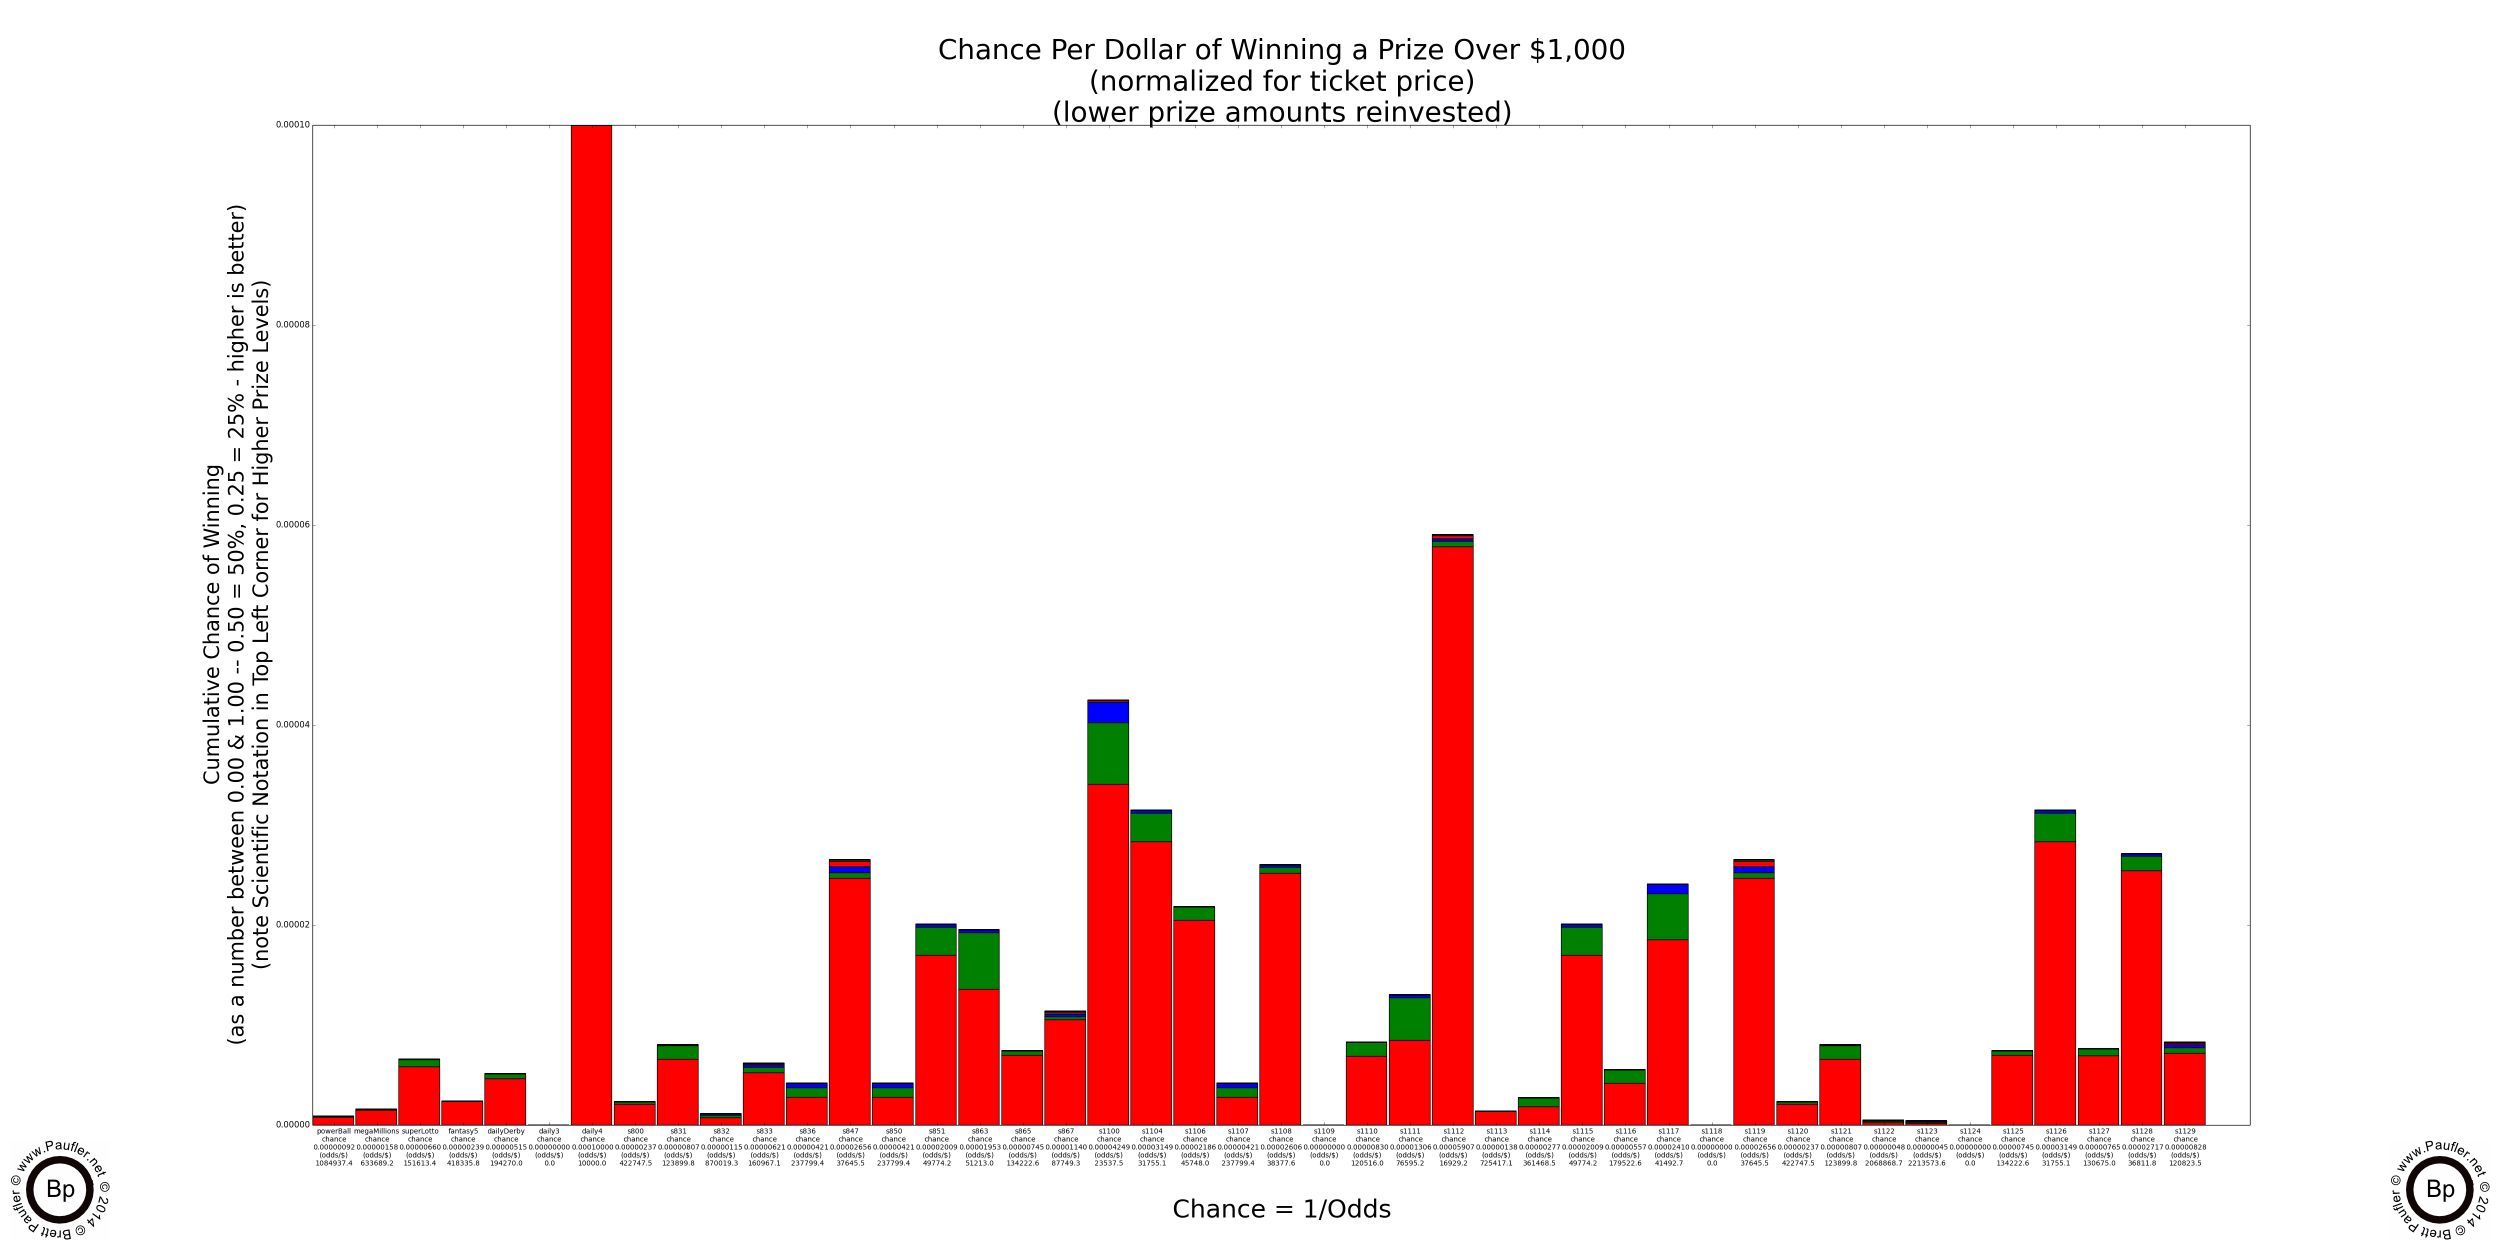
Winning $100, $1,000, $2,000 or More
NOTE: The Daily 4 compares favourably with the previous roulette analysis, paying off typically in the range of $4-6000 at 1 in 10,000 odds (vs roulette's pay off of $1,000 at 1 in 6881)
Lottery Odds Graphs
Winning $5,000, $10,000, & $100,000
NOTE: Numerous California Lottery Games pay $5,000 with odds far better than 1 in 150,000 (the odds of building one's bankroll from $1 to $2,000 in roulette, the best Casino Table Game for doing such a thing).
Lottery Odds Graph
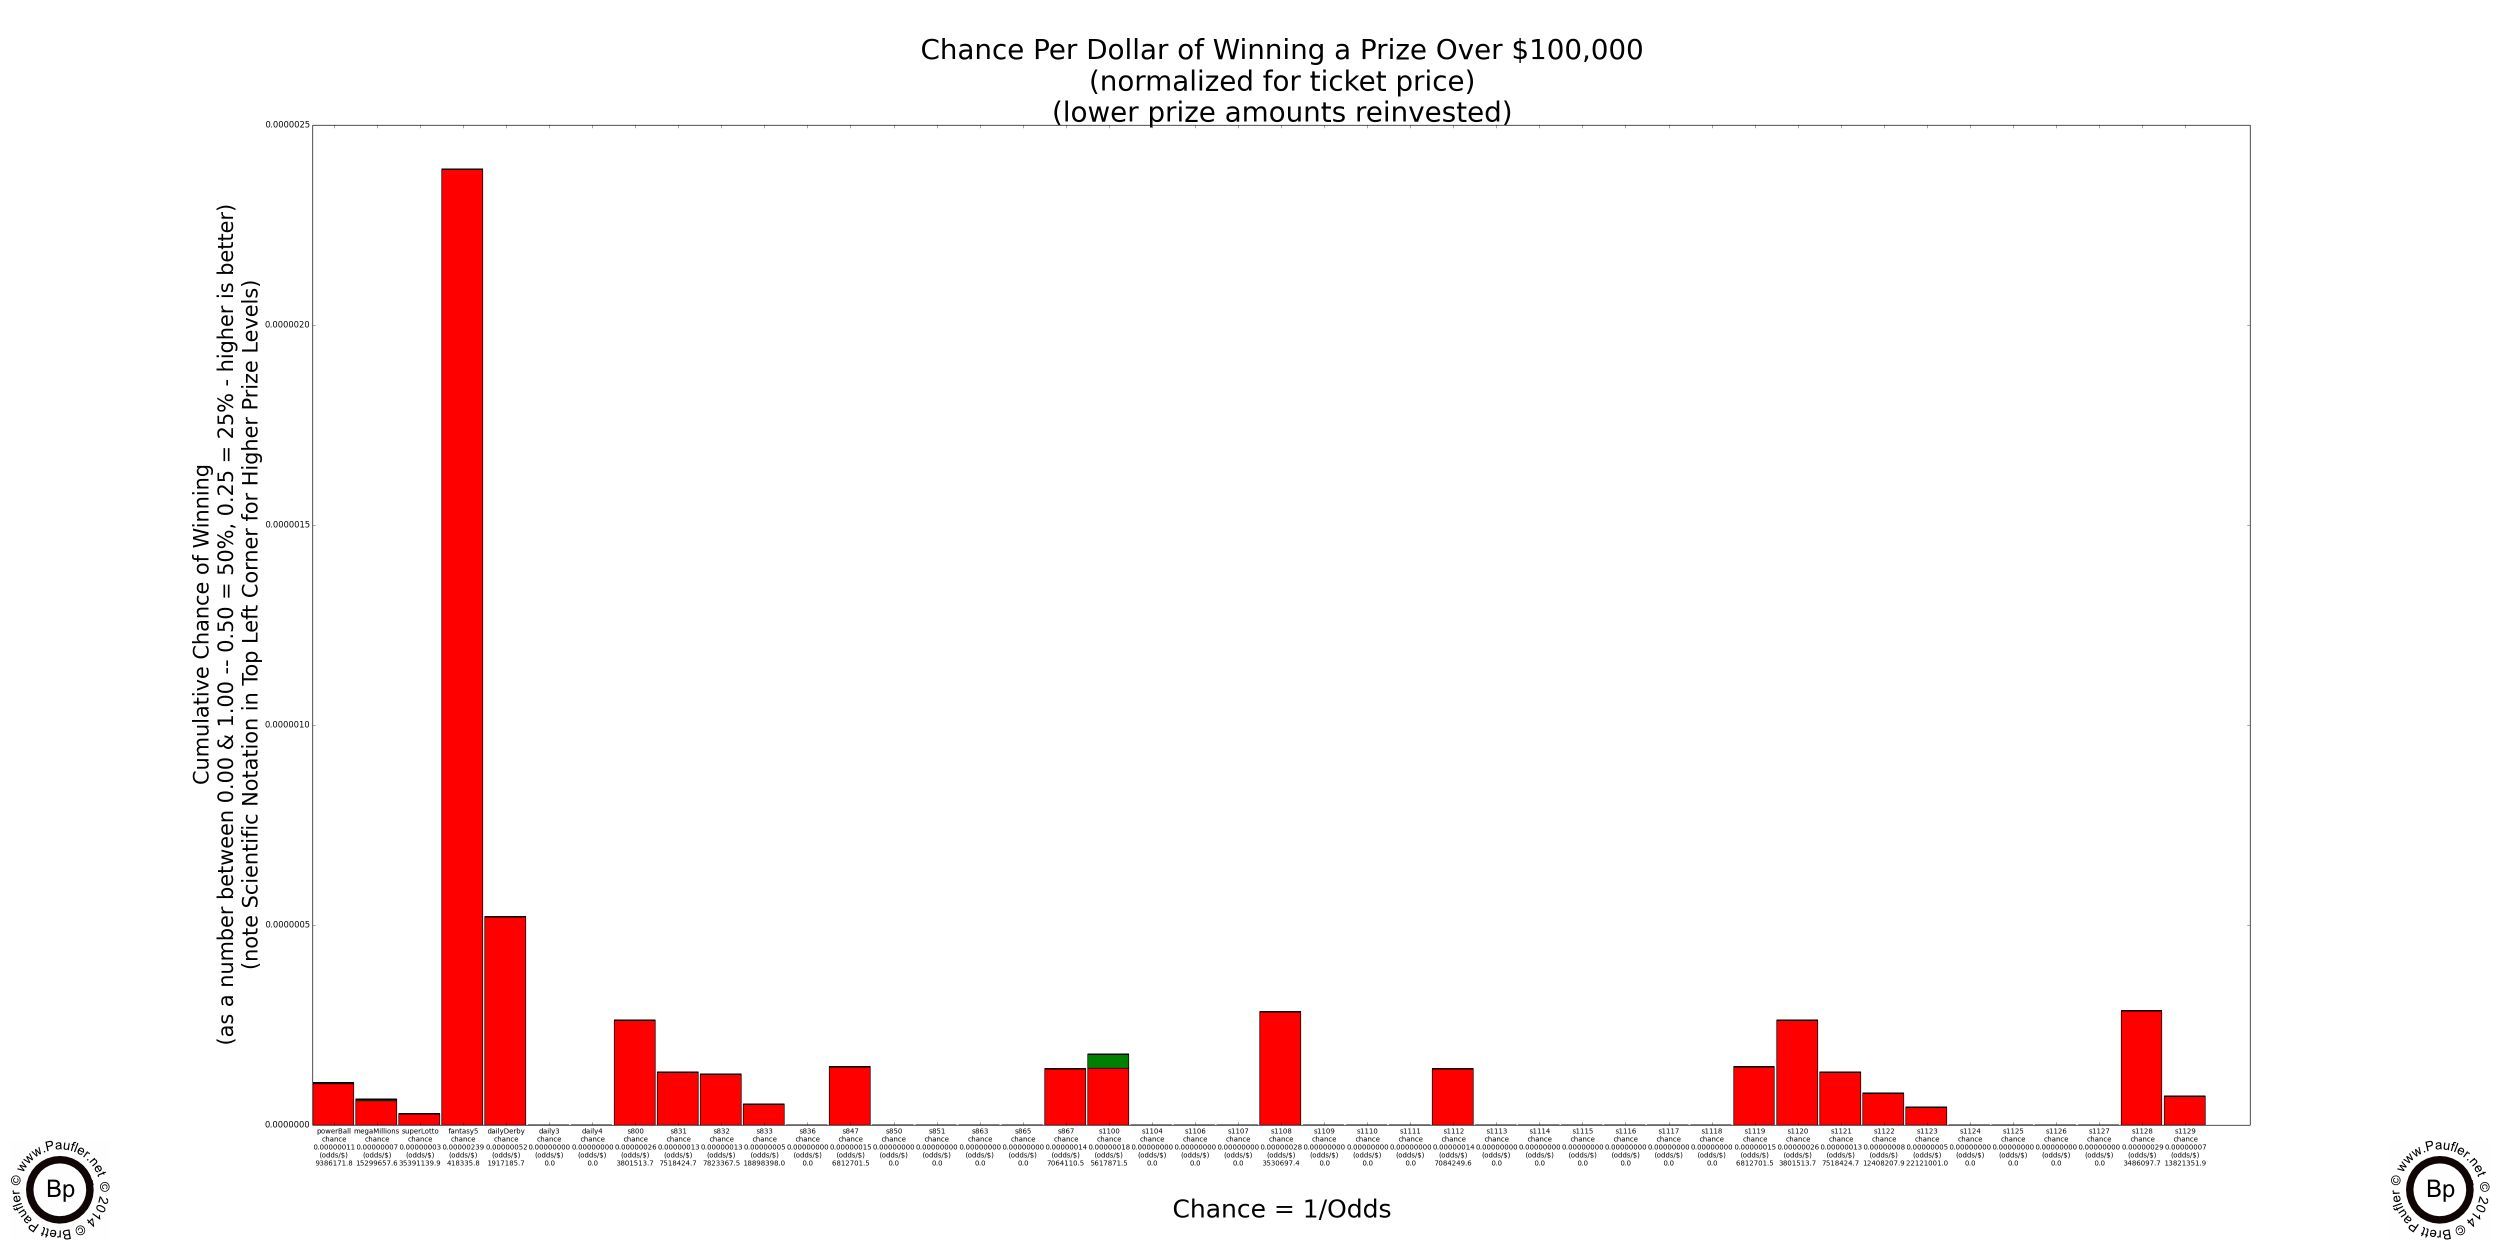
Winning $100,000 or More
Condensed Version
Only games with prizes of $100,000 or more shown.
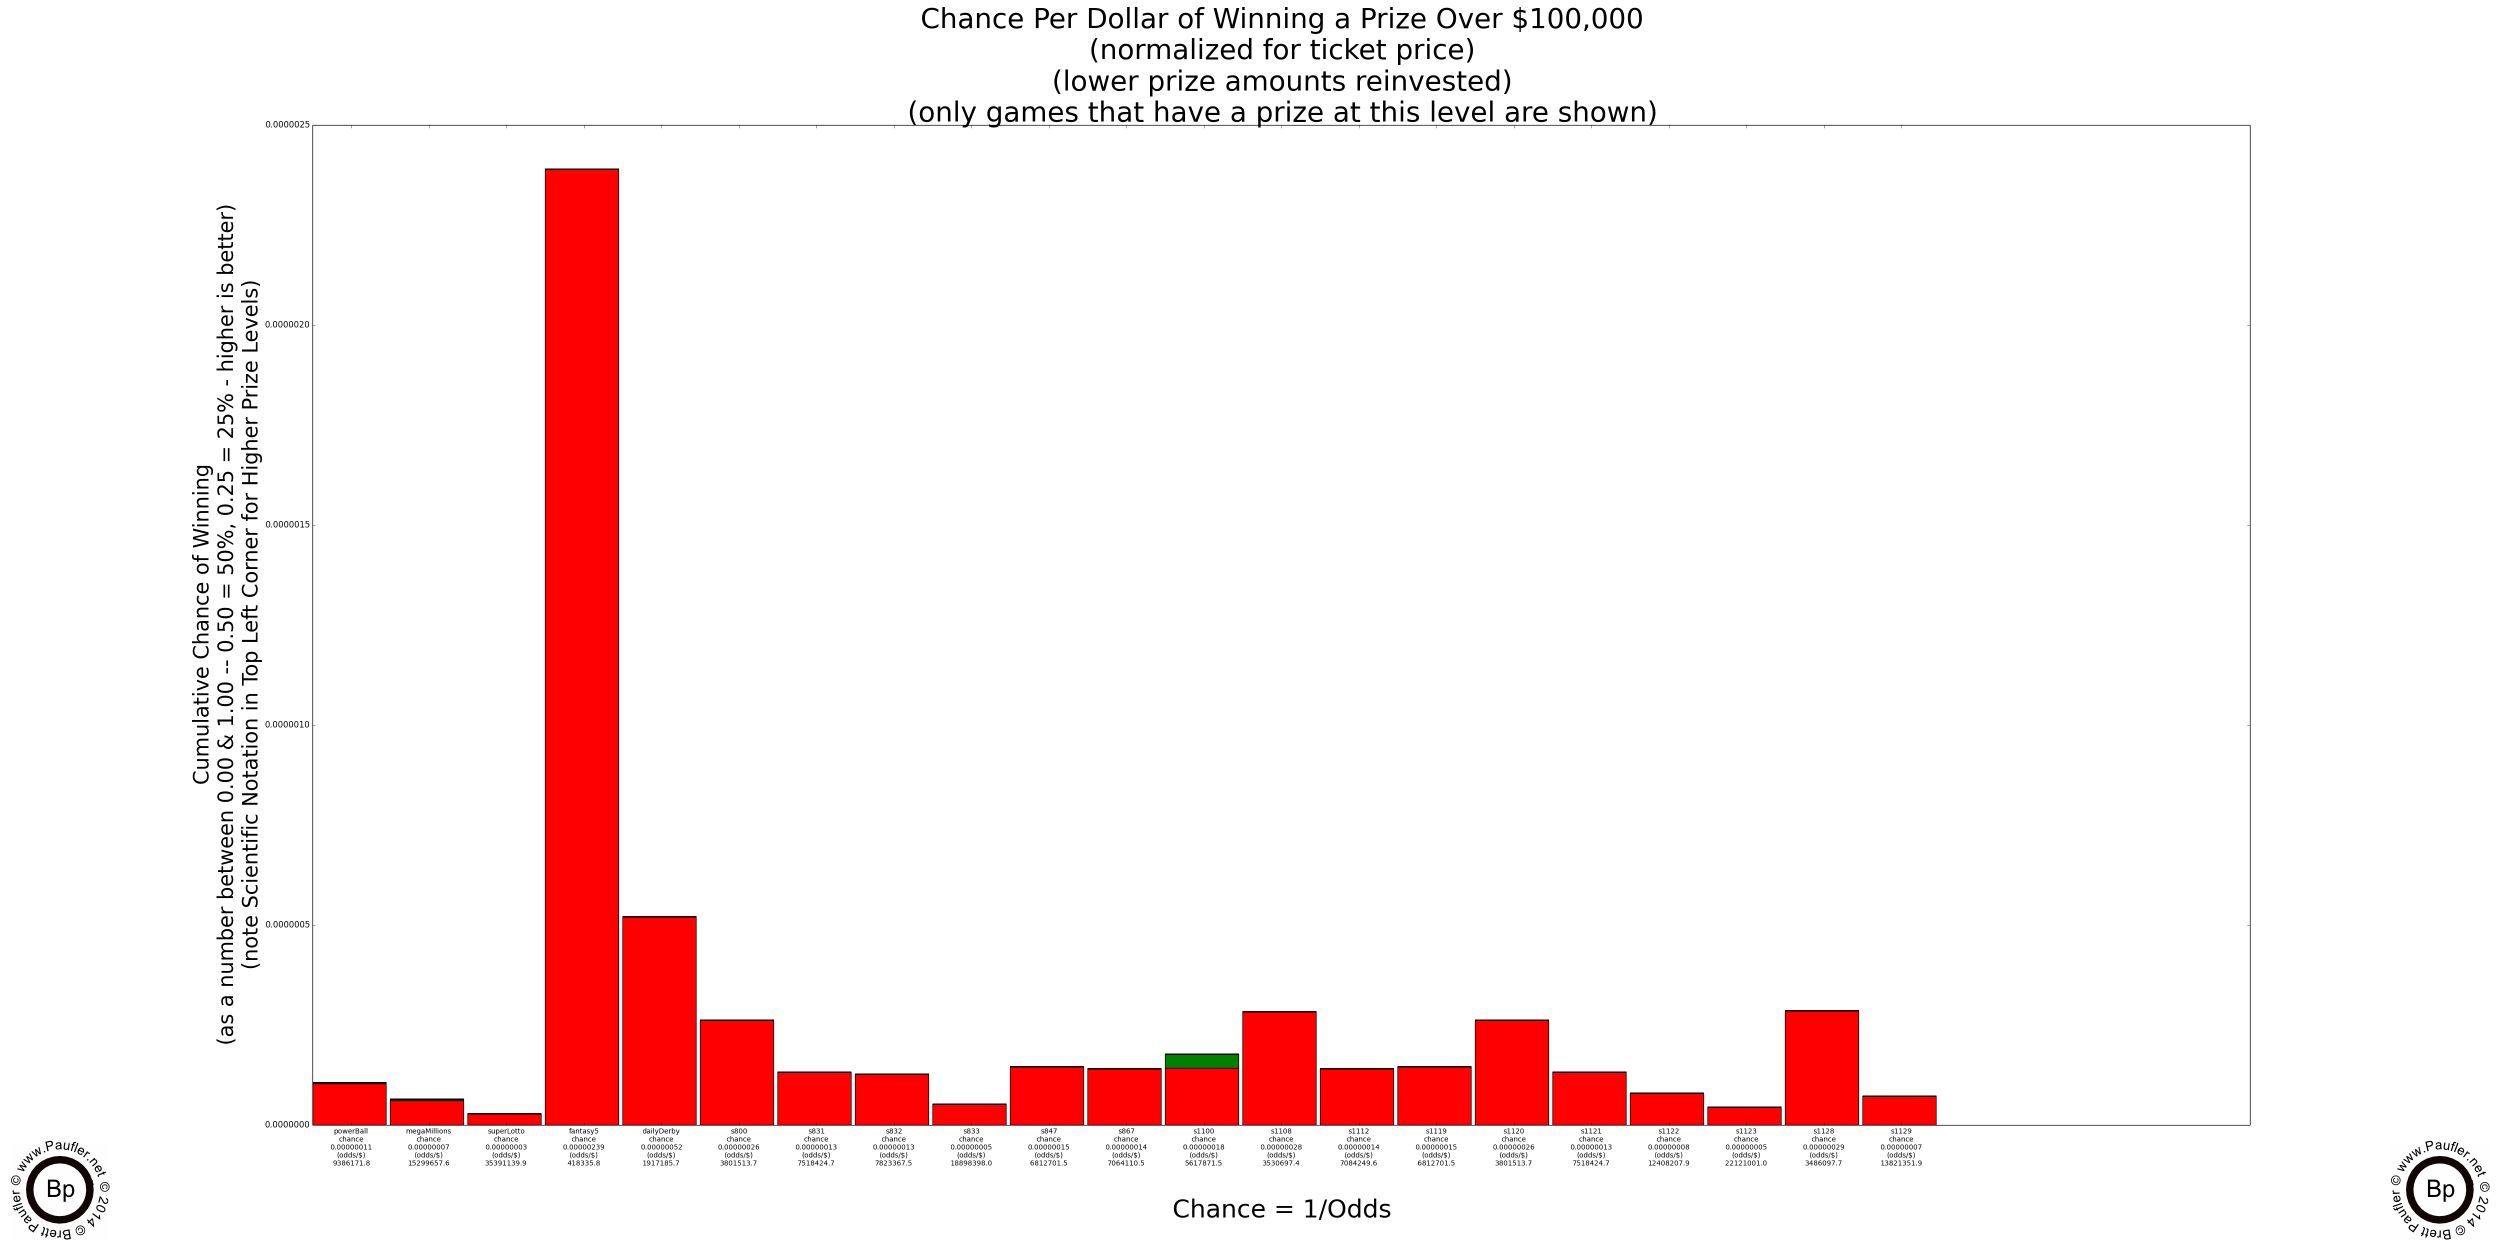
Please Note: If raw chance is the only metric one wishes to consider (we shall evaluate others further along) and one would be satisfied with a $100,000 prize, the above graph shows there is clearly a best game (Fantasy Five) that shines head and shoulders above the rest.
Lottery Odds Table
Winning $100,000 or More
Remember: Odds Normalized to a $1 Ticket
Pretty much the same as the above graph only in tabular form.
| Name | Game | Chance | Odds (1 in X) |
| Power Ball | Power Ball | 0.0000001065 | 1: 9386171.773268 |
| Mega Millions | Mega Millions | 0.0000000654 | 1: 15299657.564379 |
| Super Lotto | Super Lotto | 0.0000000283 | 1: 35391139.903118 |
| fantasy5 | fantasy5 | 0.0000023904 | 1: 418335.803965 |
| dailyDerby | dailyDerby | 0.0000005216 | 1: 1917185.738717 |
| s800 | california-lucky-for-life-800 | 0.0000002631 | 1: 3801513.703375 |
| s831 | california-lucky-for-life-831 | 0.0000001330 | 1: 7518424.660915 |
| s832 | california-lucky-for-life-832 | 0.0000001278 | 1: 7823367.540241 |
| s833 | california-lucky-for-life-833 | 0.0000000529 | 1: 18898397.977570 |
| s847 | 20x-crossword-847 | 0.0000001468 | 1: 6812701.456948 |
| s867 | california-gold-867 | 0.0000001416 | 1: 7064110.487993 |
| s1100 | %245-million-jackpot-1100 | 0.0000001780 | 1: 5617871.511378 |
| s1108 | 20x-the-money-1108 | 0.0000002832 | 1: 3530697.380485 |
| s1112 | ca-black-exclusive-1112 | 0.0000001412 | 1: 7084249.560462 |
| s1119 | bonus-crossword-1119 | 0.0000001468 | 1: 6812701.456948 |
| s1120 | california-lucky-life-1120 | 0.0000002631 | 1: 3801513.703375 |
| s1121 | california-lucky-life-1121 | 0.0000001330 | 1: 7518424.660915 |
| s1122 | california-lucky-life-1122 | 0.0000000806 | 1: 12408207.864001 |
| s1123 | california-lucky-life-1123 | 0.0000000452 | 1: 22121000.998287 |
| s1128 | wheel-of-fortune-1128 | 0.0000002869 | 1: 3486097.690578 |
| s1129 | wheel-of-fortune-1129 | 0.0000000724 | 1: 13821351.860686 |
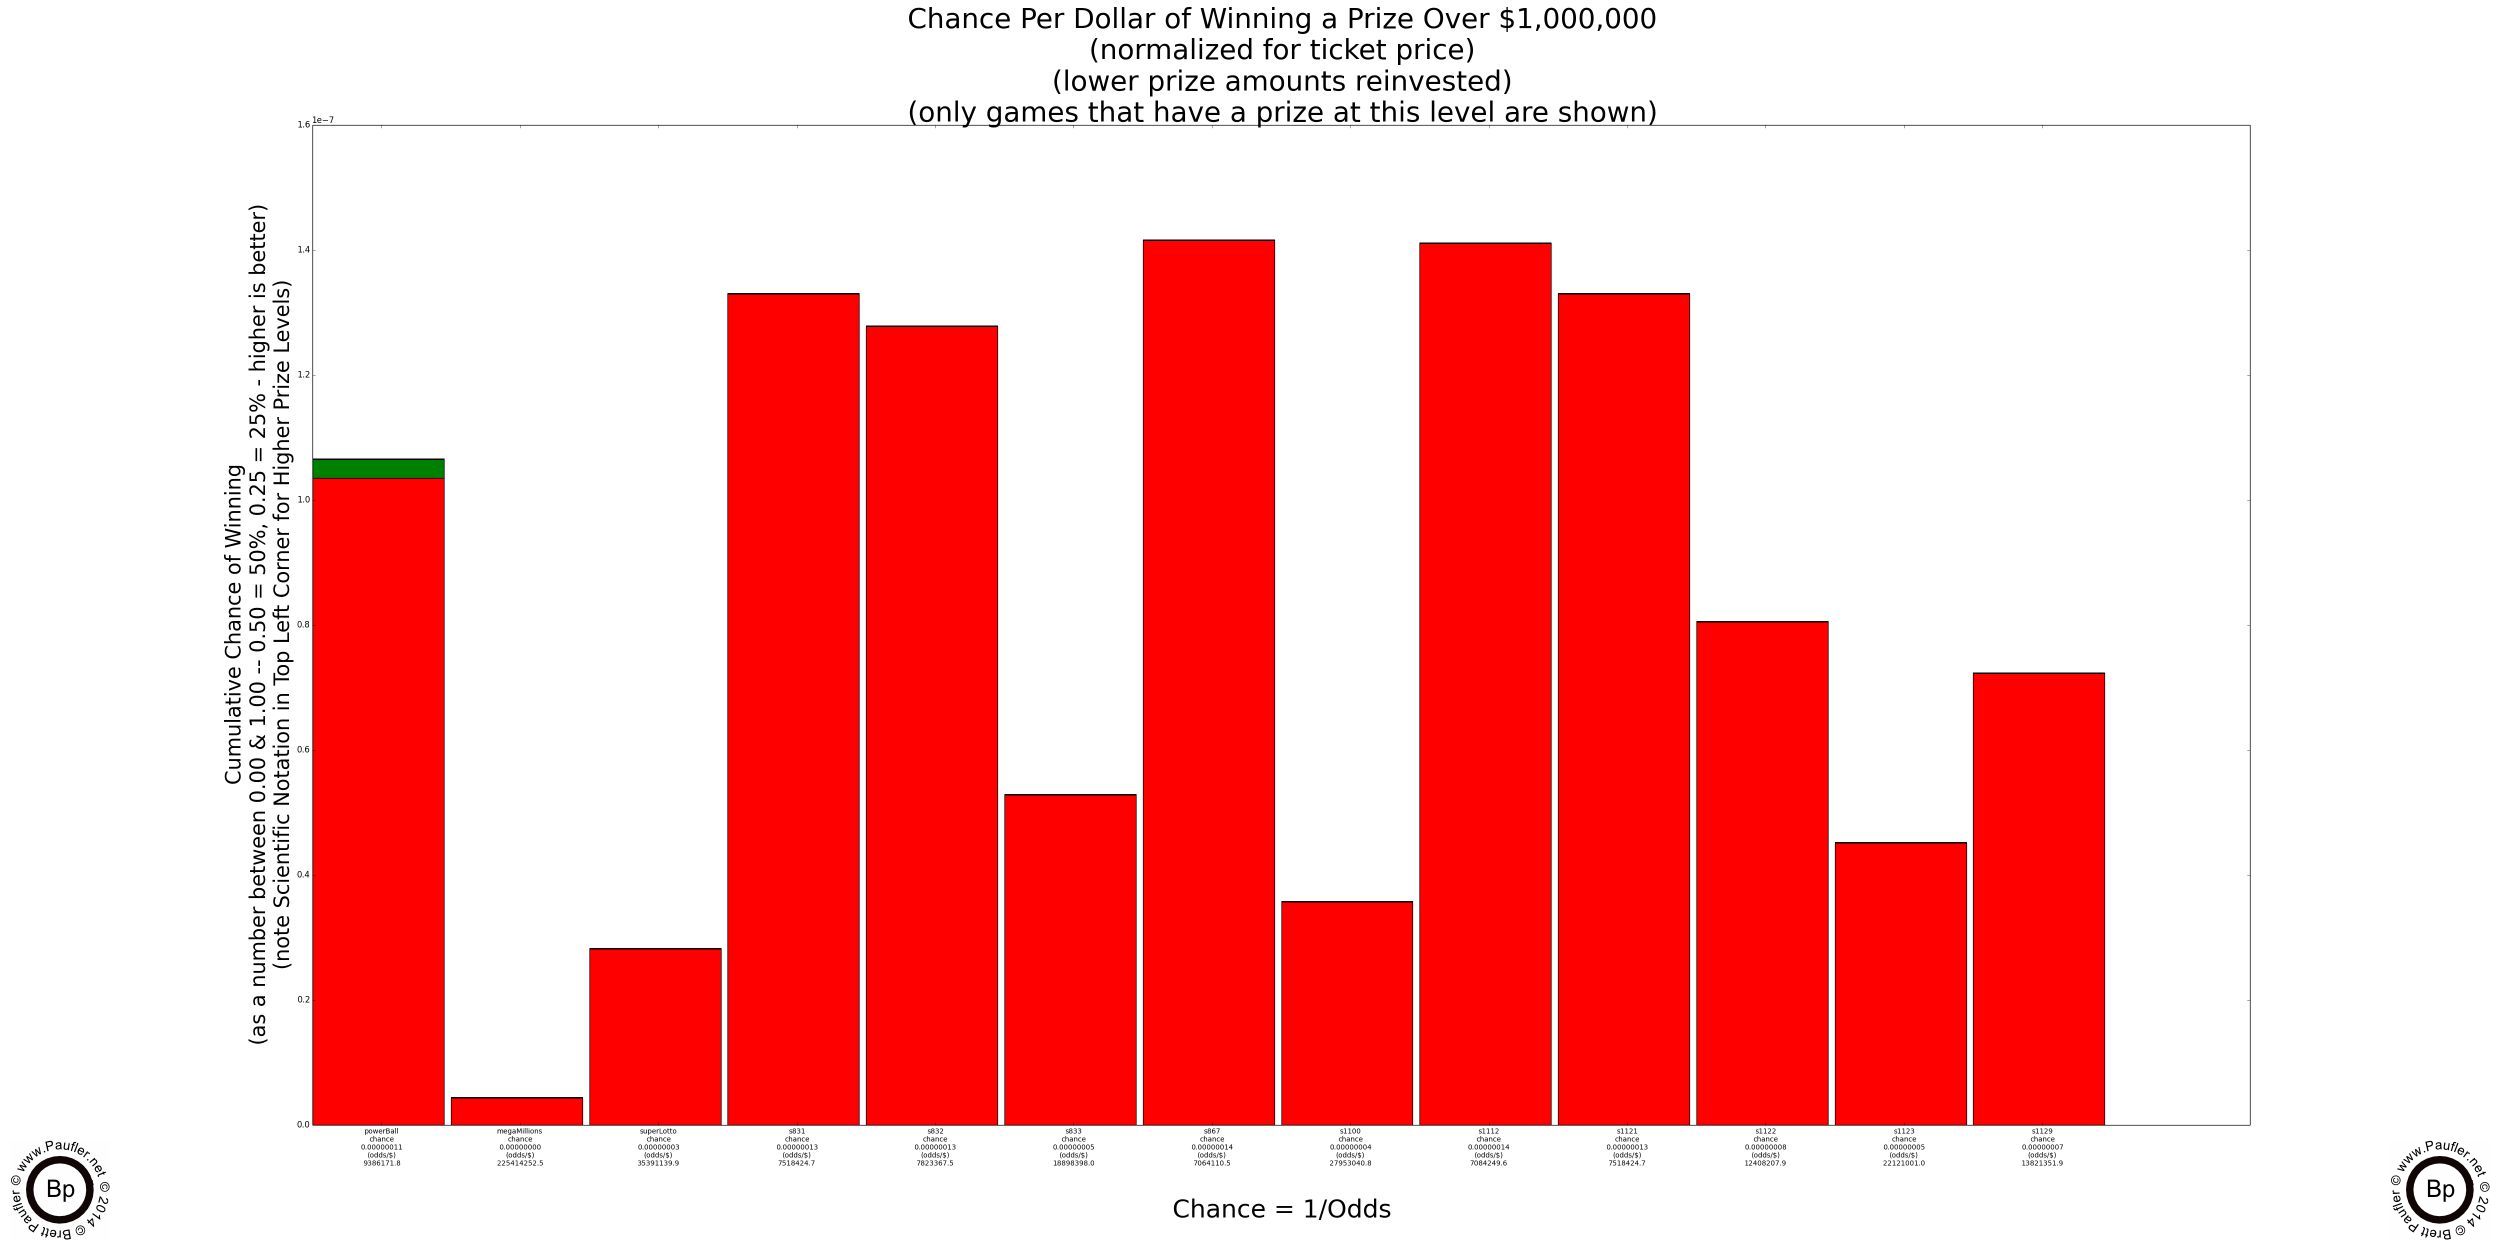
Lottery Odds Graph
Winning $1,000,000 or More
Please note the scientific notation. The chances of winning are quite low as the table below the graph will attest.
Also note: Power Ball has a second jackpot that is typically worth more than a million. It's like playing two games in one. Perhaps that's why it costs $2/play? Either way, most of the height for the Power Ball column is for the lower jackpot (red) not the big one (shown in green).
Lottery Odds Table
Winning $1,000,000 or More
Odds Normalized to a $1 Ticket
| Name | Game | Chance | Odds |
| Power Ball | Power Ball | 0.0000001065 | 1: 9386171.773268 |
| Mega Millions | Mega Millions | 0.0000000044 | 1: 225414252.466329 |
| Super Lotto | Super Lotto | 0.0000000283 | 1: 35391139.903118 |
| s831 | california-lucky-for-life-831 | 0.0000001330 | 1: 7518424.660915 |
| s832 | california-lucky-for-life-832 | 0.0000001278 | 1: 7823367.540241 |
| s833 | california-lucky-for-life-833 | 0.0000000529 | 1: 18898397.977570 |
| s867 | california-gold-867 | 0.0000001416 | 1: 7064110.487993 |
| s1100 | %245-million-jackpot-1100 | 0.0000000358 | 1: 27953040.843746 |
| s1112 | ca-black-exclusive-1112 | 0.0000001412 | 1: 7084249.560462 |
| s1121 | california-lucky-life-1121 | 0.0000001330 | 1: 7518424.660915 |
| s1122 | california-lucky-life-1122 | 0.0000000806 | 1: 12408207.864001 |
| s1123 | california-lucky-life-1123 | 0.0000000452 | 1: 22121000.998287 |
| s1129 | wheel-of-fortune-1129 | 0.0000000724 | 1: 13821351.860686 |
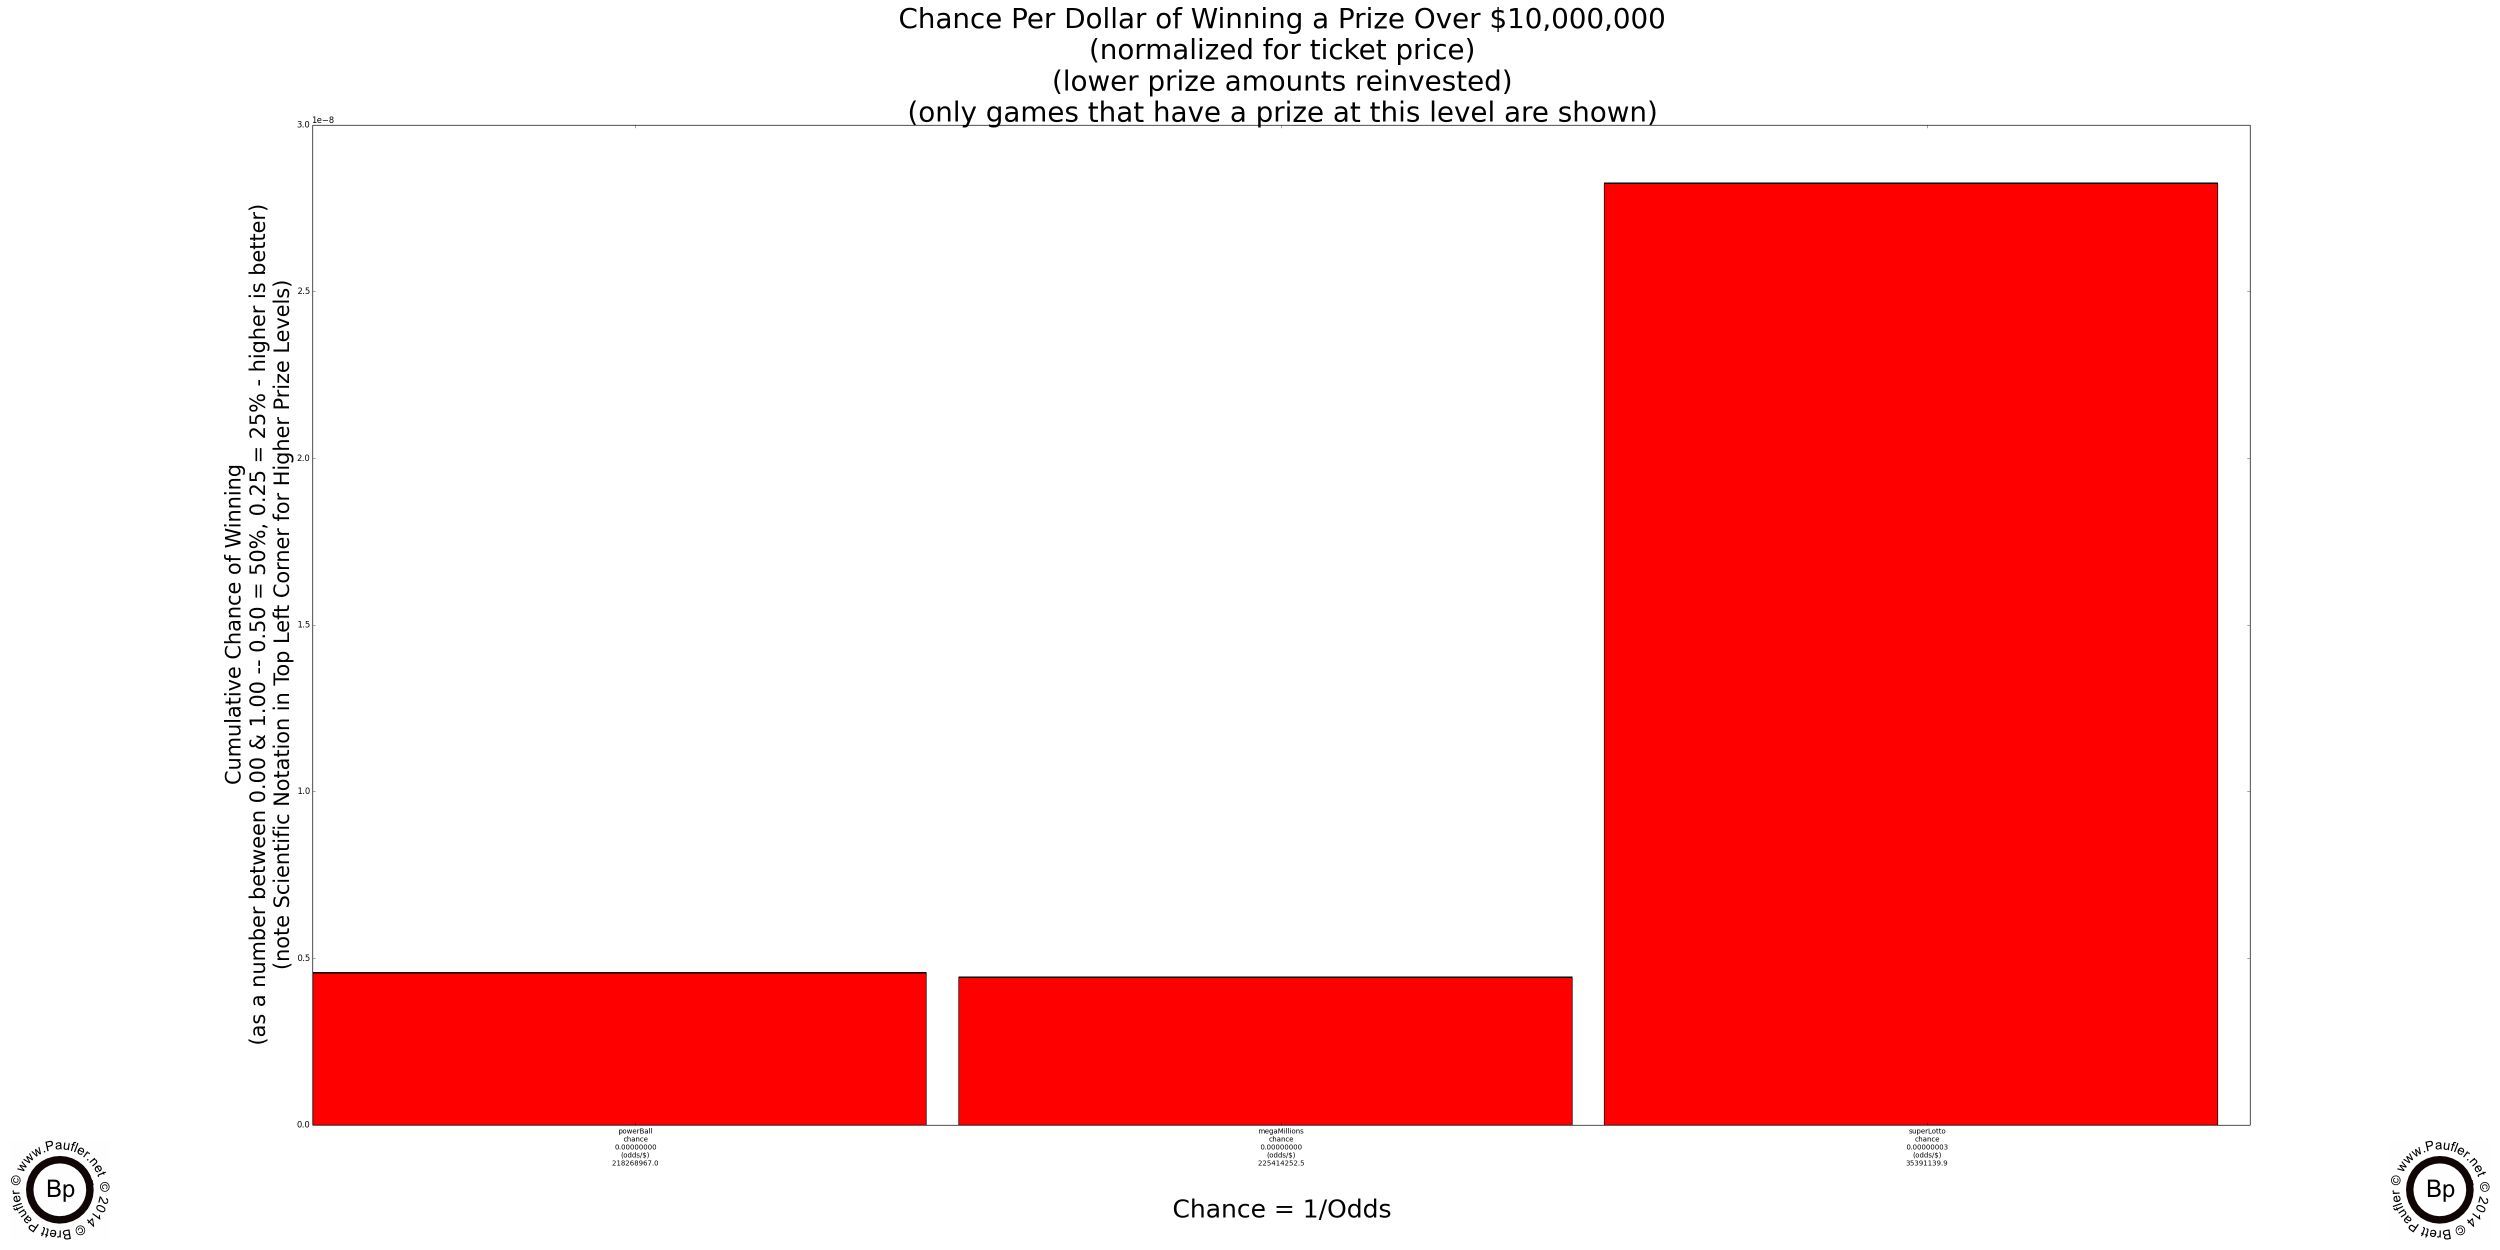
Lottery Odds Graph
Winning $10,000,000 or More
Note: do to the variable nature of jackpots, the Super Lotto will not always make this cut off.
Lottery Odds Table
Winning $10,000,000 or More
Odds Normalized to a $1 Ticket
| Name | Game | Chance | Odds |
| Power Ball | Power Ball | 0.0000000046 | 1: 218268966.990804 |
| Mega Millions | Mega Millions | 0.0000000044 | 1: 225414252.466329 |
| Super Lotto | Super Lotto | 0.0000000283 | 1: 35391139.903118 |
Playing the Odds is a simple (if simplistic) lottery strategy. All one has to do is look at the published odds chart for the various games (or look at the above graphs, which account for the reinvestment of free tickets and low level prizes) and determine which game has the best odds. It's simple. It's easy. And there's really nothing wrong with it. However, it seems unlikely to me that you'd bother reading this article if you were satisfied with such an answer and even more unlikely (like totally unlikely) that I would spend so long composing an article such as this if I was satisfied with such an answer.
Or to put it another way, chance is only one dynamic of the lottery, the other is the truly staggering size of the prizes. If one only looked at chance, one would always select playing the Super Lotto over either the Power Ball or Mega Millions, because the Chance of winning the Super Lotto jackpot is way (way-way-way) better than the raw chance of winning either the Power Ball or Mega Millions. But (and this is the real but, gist, and purpose for this article) the Power Ball and/or Mega Millions jackpot is usually much (much-much-much) higher that the corresponding Super Lotto Jackpot.
So, the question isn't (and never has been) what's the game with the best odds (that's a trivial question). The question is more like: Given that the chance of winning the Super Lotto jackpot is three times better than Power Ball lotto, but the Power Ball has a jackpot that's five times as large (and a smaller jackpot that is often worth a million plus), is one's money better spent buying two Super Lotto or one Power Ball lottery tickets.
Implicit in a question like that is an awareness of the jackpot prize levels and so any metric (formula, guideline, etc.) that desires to answer such a question MUST be based in part not just on the chance of the event but also on the relative prize levels involved.
Probably obvious. I've been known to beat a dead horse. (I swear he was like that when I got there, officer.) But it's something which needs to be stated explicitly in a paper like this. And having said it, now is the time to take a closer look at the prize levels and see what kind of metrics can be derived there from.
Distribution of Prizes
Chance vs Prize Level Graphs
The following are scatter-plot diagrams taking the chance (as computed for the chance graphs in the previous section) plotted against the dollar amount of the prizes involved.
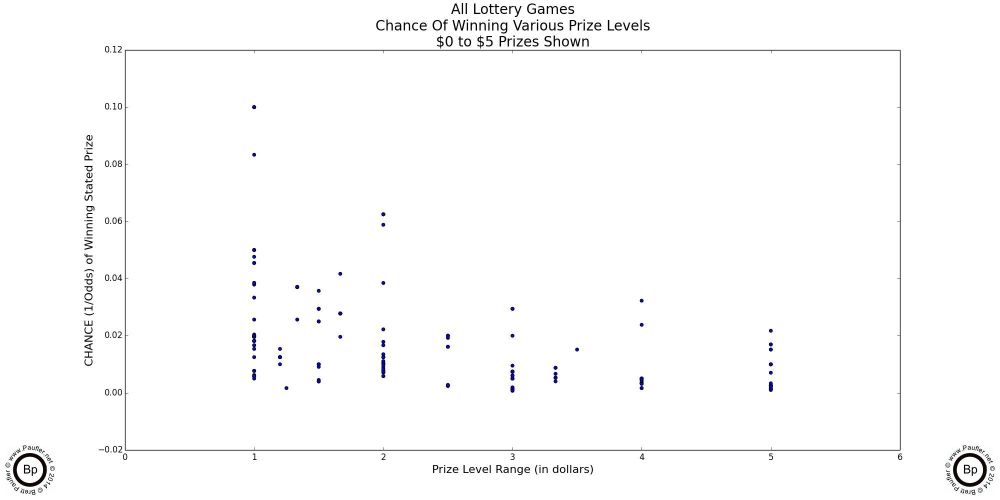
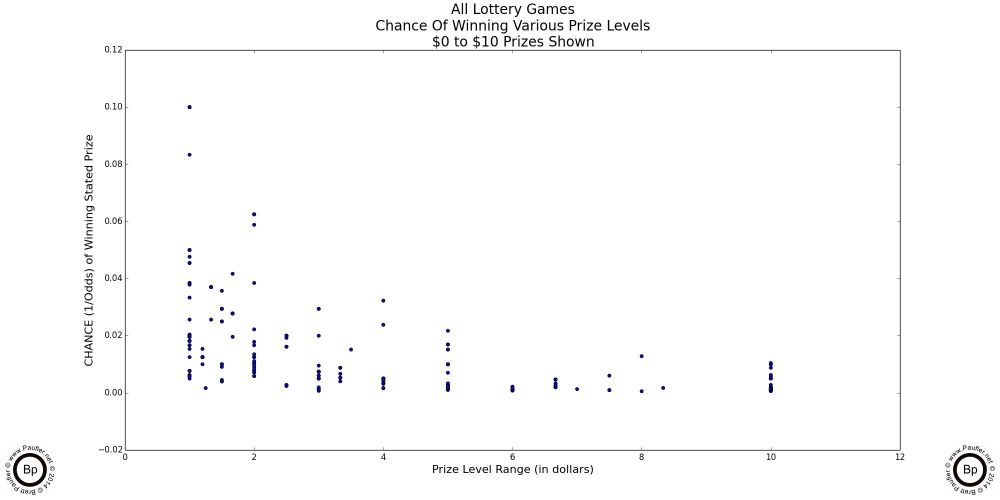
At the lowest prizes levels (up to $5 in the graph above left: up to $10 in the graph above center), the mix is pretty random. The vertical lines are due to the incremental nature of lottery game prizes -- i.e. there is no $2.50 lottery prize.
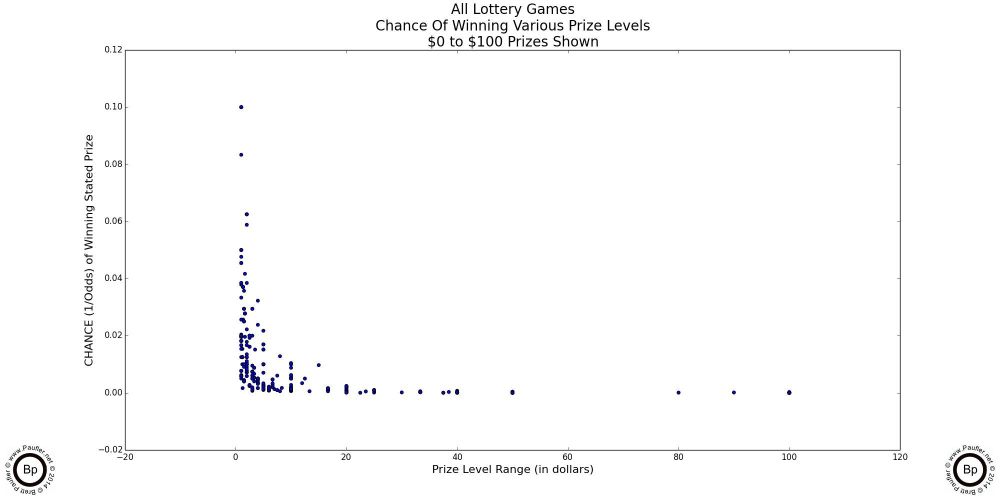
However, at the $100 inclusive level (the graph at above right) the plot begins to take on its true form.
And by the time we get to the graphs below, what we find are two trend lines (rather than the one I was expecting). One going vertical at what amounts to a $0 prize and one wherein the chance to win is essentially 0.00. To my mind, it's a very informative split. (Obviously, $0 & 0.00 are conceptual simplifications; but if you are like me, a $10 prize is just that many more lottery tickets; and so, isn't so much a prize, as additional tries at winning a prize; and as the odds approach 1 in 1,000,000 for the prizes I'm interested in, the chance really does tend towards zero, so the simplification is fair and reasonable in my mind).
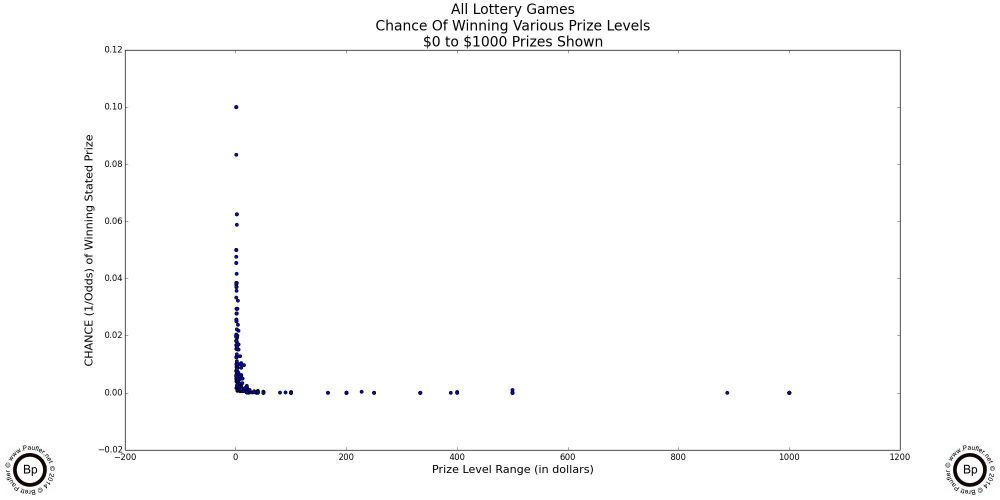
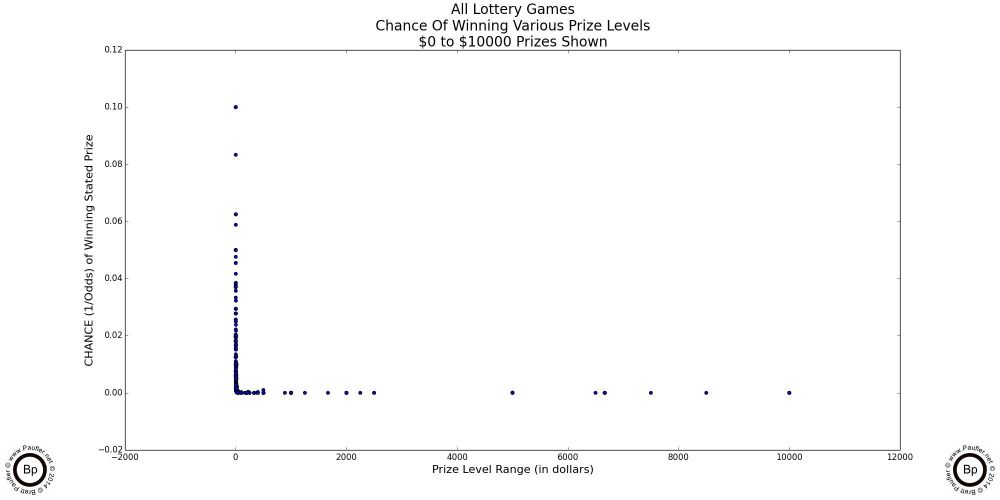
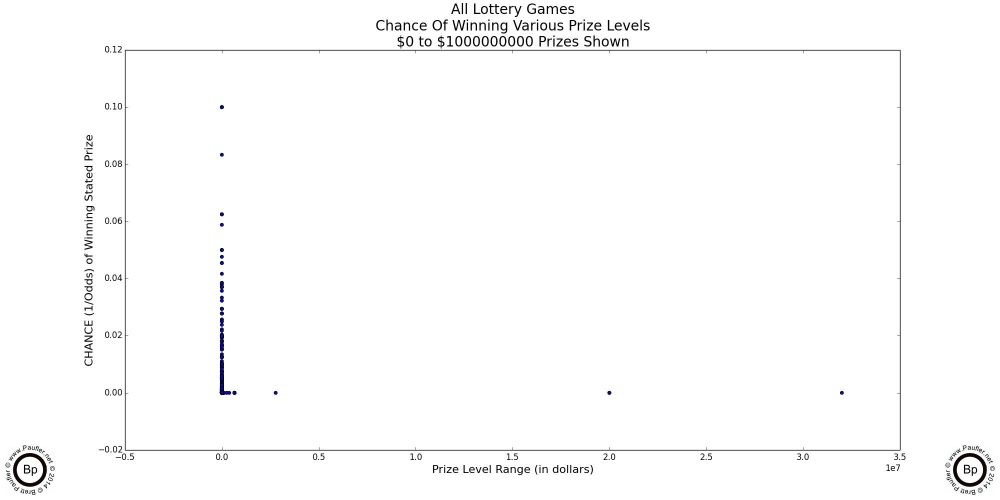
The vertical line in the last graph depicts where most of the 'action' occurs (where most of the prizes are), while the horizontal line is where the big dreams lie (why we -- or at least, I -- are playing these games).
Typically (by me if no one else) a metric known as 'Return per Dollar' is utilized to analyse what is going on here. And I will turn to that in just a moment after one last table that tabulates the prizes available at the different cut off levels.
But if you want the short form answer, the small prizes tend to disappear as most serious gamblers will simply reinvest these winnings. In other words, they aren't really prizes. And so this means (in short form), if one wants to develop a winning lottery (or gambling strategy in general), the trick is to avoid those low level prizes which have no way of leading to a real prize (i.e. if you want to win a million dollars, don't play games that don't have million dollar jackpots; and from there, play those games which give you the best bang for the buck: e.g. highest Return per Dollar).
California Lottery
Distribution of Prizes
There are many more smaller prizes than big prizes. This should not come as a surprise to anyone.
| At or Above This Amount | Number of Prizes |
| $0 (ALL Prizes) | 469 |
| $5 | 422 |
| $10 | 378 |
| $100 | 201 |
| $1,000 | 119 |
| $10,000 | 58 |
| $100,000 | 24 |
| $1,000,000 | 14 |
| $10,000,000 | 3 (varies) |
These are not bands, but totals.
3 is part of 14 is part of 24, etc..
In the end, the real problem with the above table and graphs isn't that they don't provide any information (they provide plenty of information), it's that the information they provide is only a partial picture and in many ways taken out of context.
A Return per Dollar metric should add back the missing context without reintroducing any additional complexity. Let's keep things nice and simple, shall we?
#Return Per Dollar
rpd = Prize / (Odds * ticketPrice)

While the 'House Edge' is (1 - rpd)
Return per Dollar versus House Edge
| Game | House Edge | Return per Dollar |
| Coin Toss | 0.00000 | 1.00000 |
| craps | 0.01414 | 0.98586 |
| blackjack | 0.07280 | 0.92720 |
| roulette | 0.05263 | 0.94737 |
Coin Toss is our benchmark 'Fair Game'; and so, as stated previously, has no House Edge and a Return per Dollar of one.
The reason craps is touted as being such a good game by so many people is because it's House Edge is so low. And since the two are related a low House Edge means a high Return per Dollar.
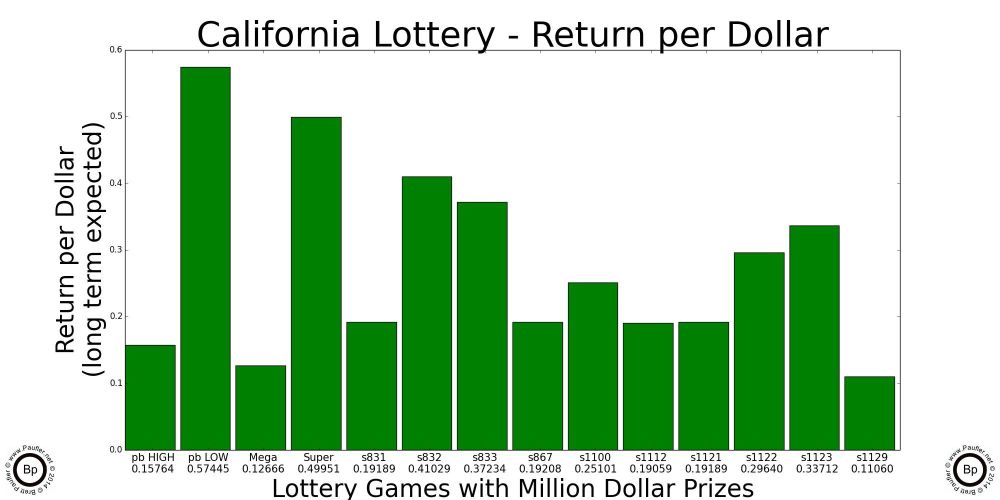
Since this isn't a very complicated concept and we all now know what Return per Dollar means, it's probably time to graph this metric. The following graphs show the Return per Dollar for every California Lottery Game (as of 7-11-12), breaking out the Return per Dollar for each individual prize (what fraction of the ticket price is returned as prizes at each level).
Return per Dollar Graph for All California Lottery Games
Prize Levels are stacked lowest to highest so the uppermost band is the top prize in each game.
At far right is the Return per Dollar for Roulette as a point of reference.
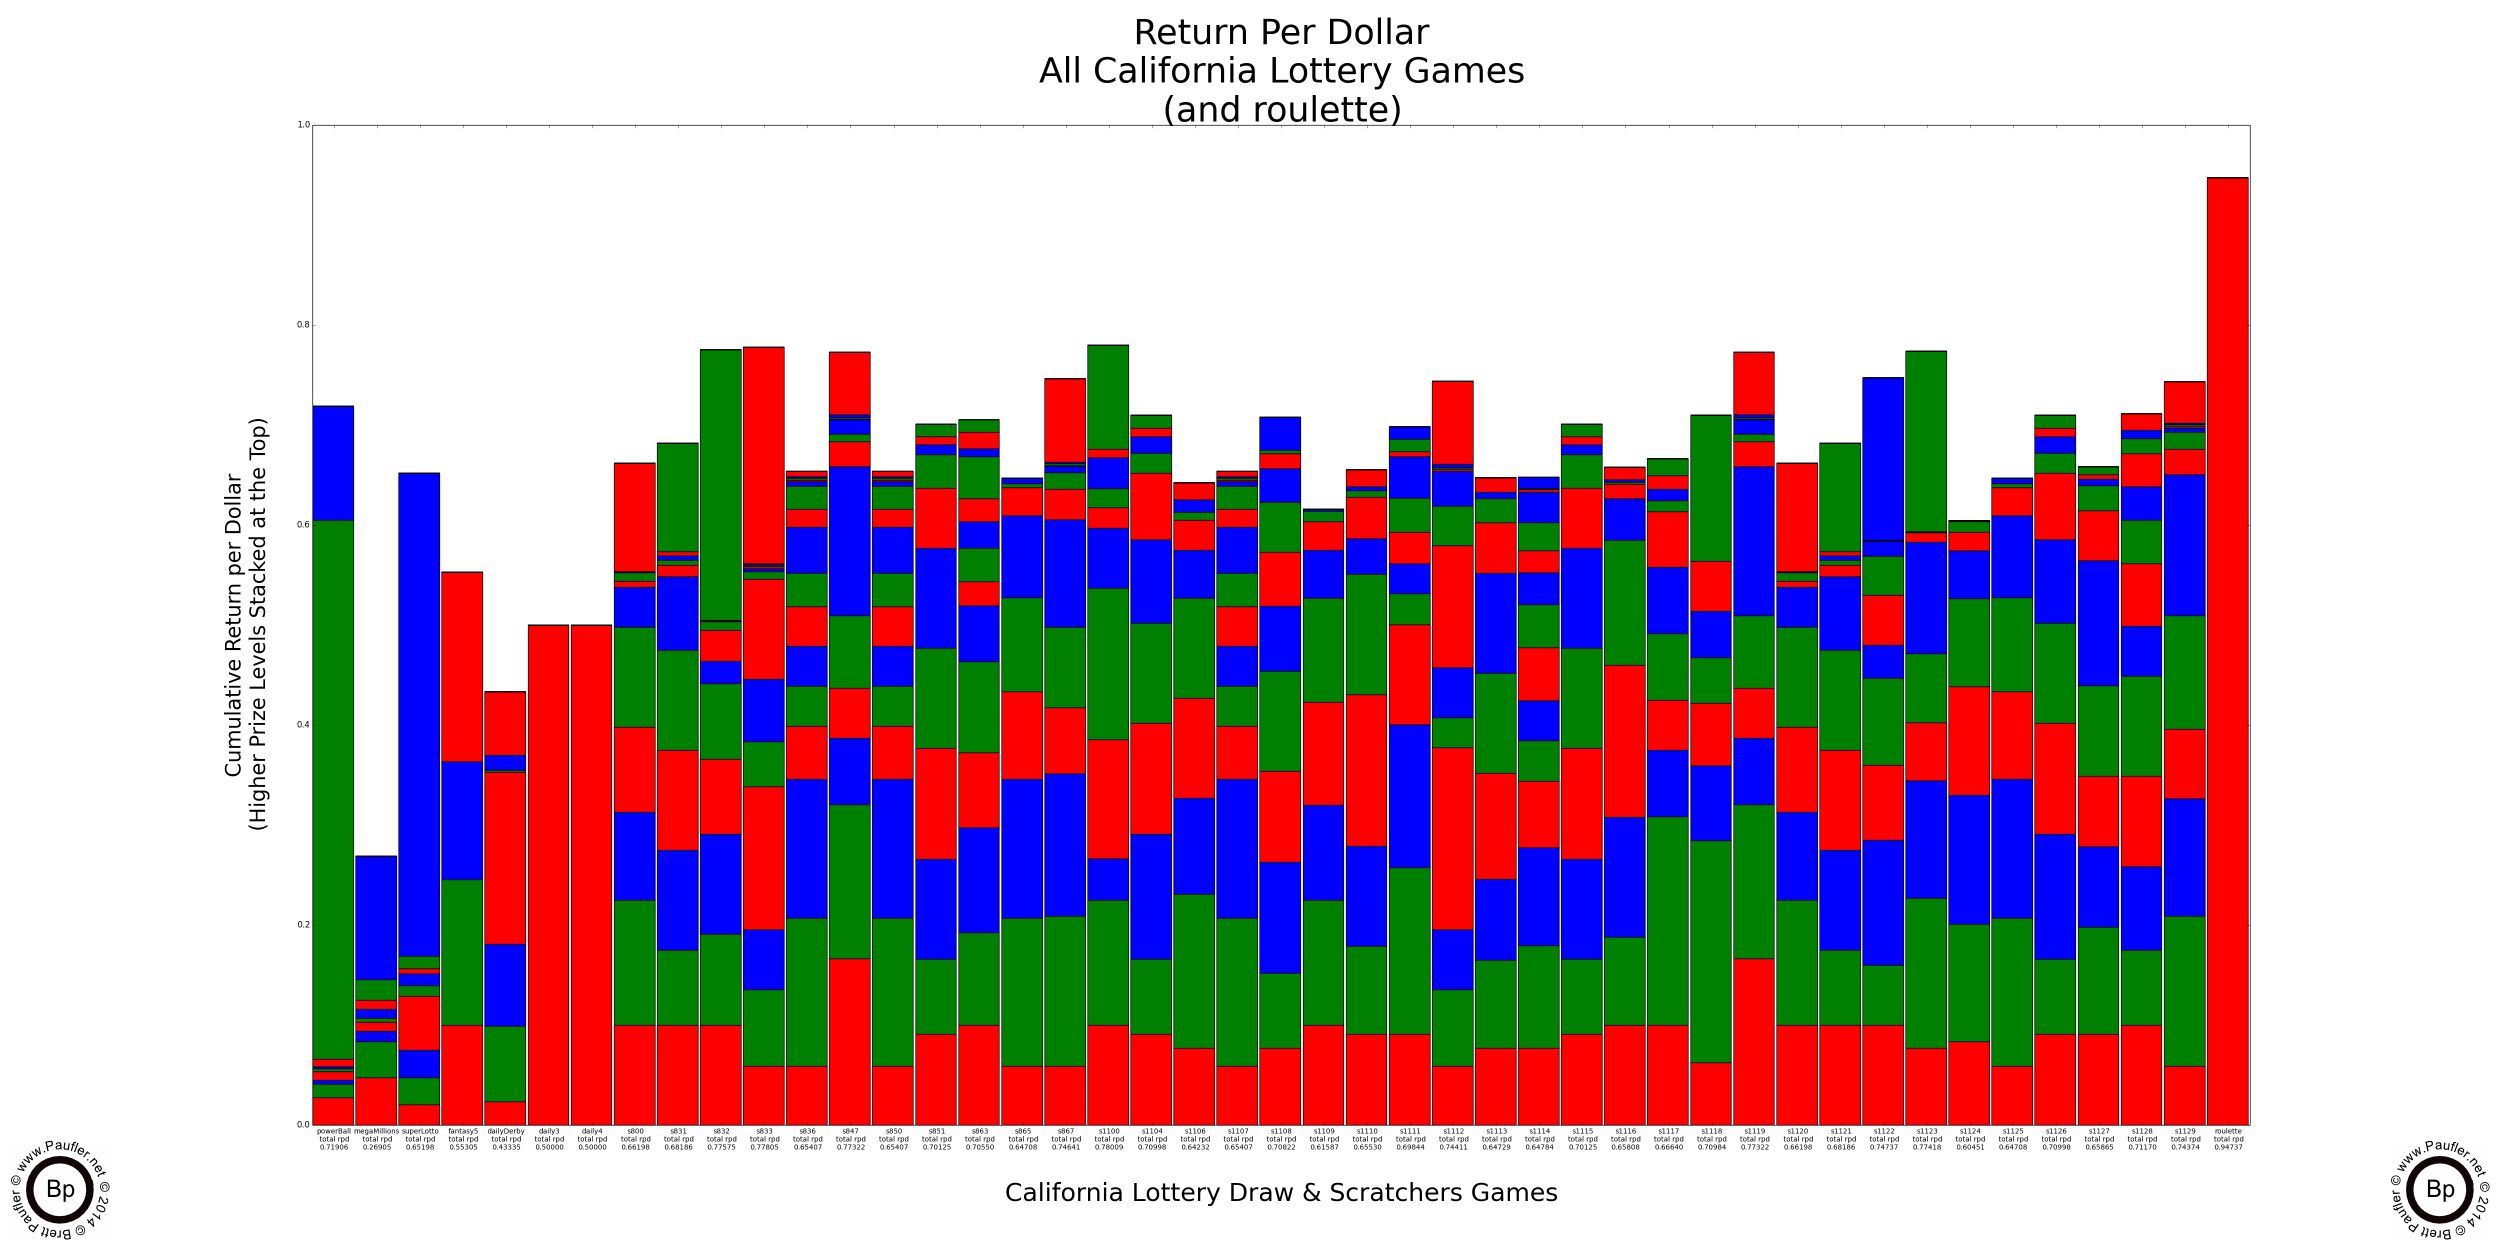
Please notice how almost all of the money returned to the player for Power Ball, Mega Millions (not so much for this data), and Super Lotto is in the top prizes. This is exactly what a high odds gambler wants to see (at least, if that high odds gambler is me).
In my opinion (be it ever so humble), the price paid (increase in House Edge) from a 35 to 1 roulette payout to a million to one lottery payout isn't very steep. It actually looks like a bargain to me. In any case, opinion aside, the Return per Dollar for these games hovers in the 0.60 to 0.80 per dollar range (60c to 80c / Dollar).
Return per Dollar Graphs for Games with Prizes Over $100,000 and $1,000,000
Only games with prizes at these levels shown.
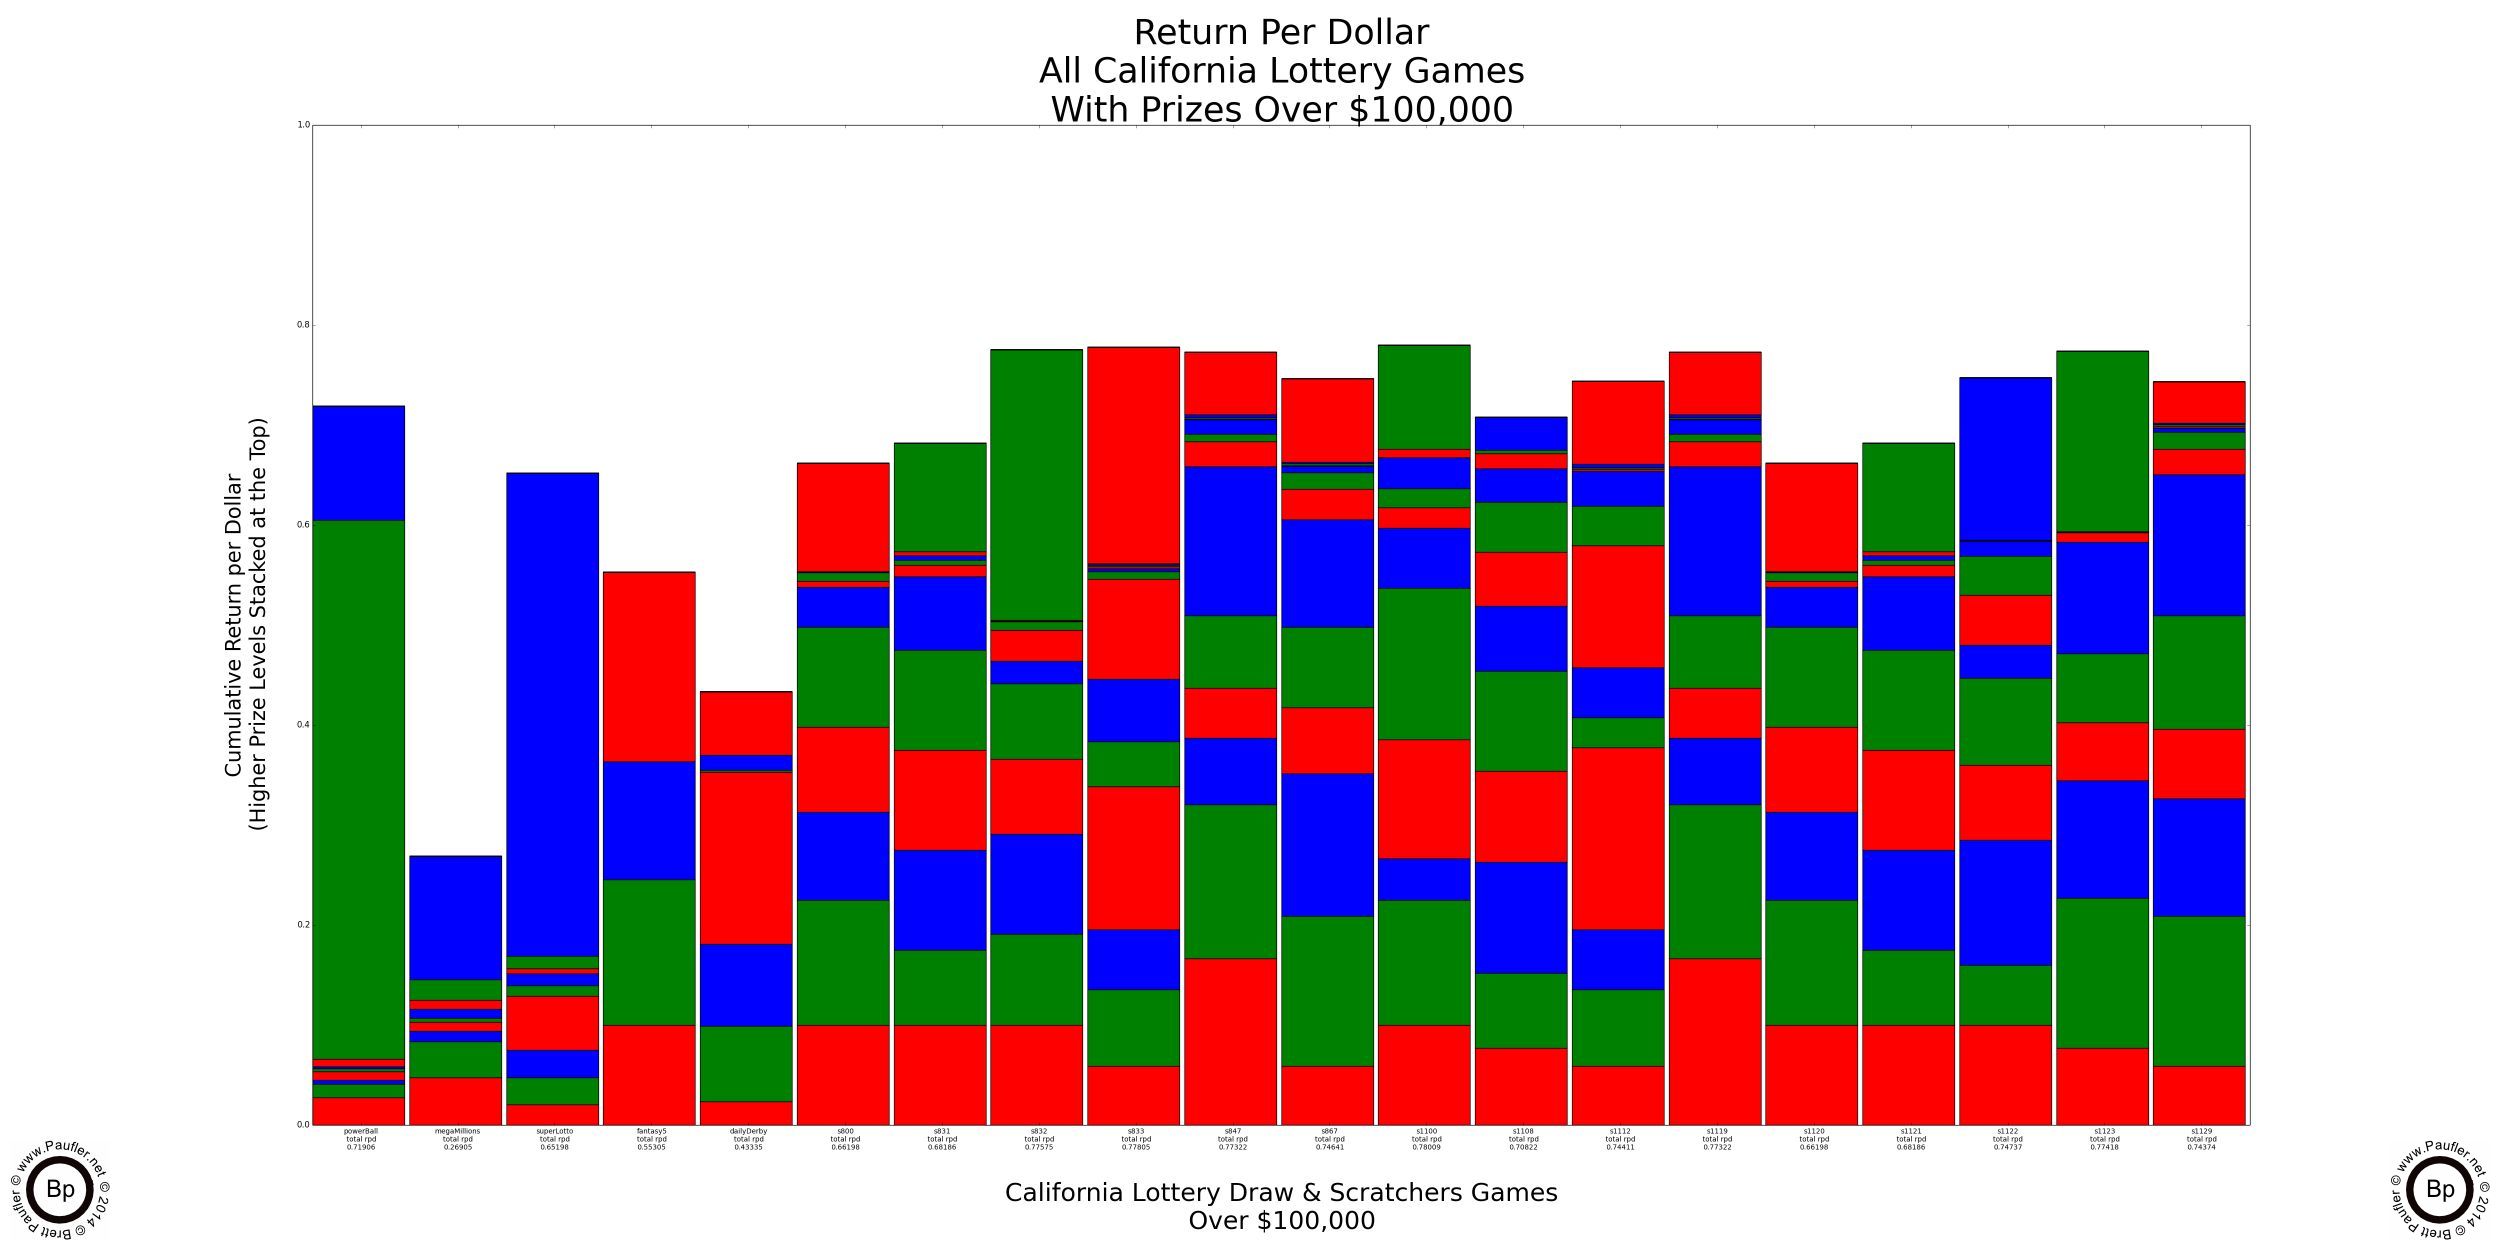
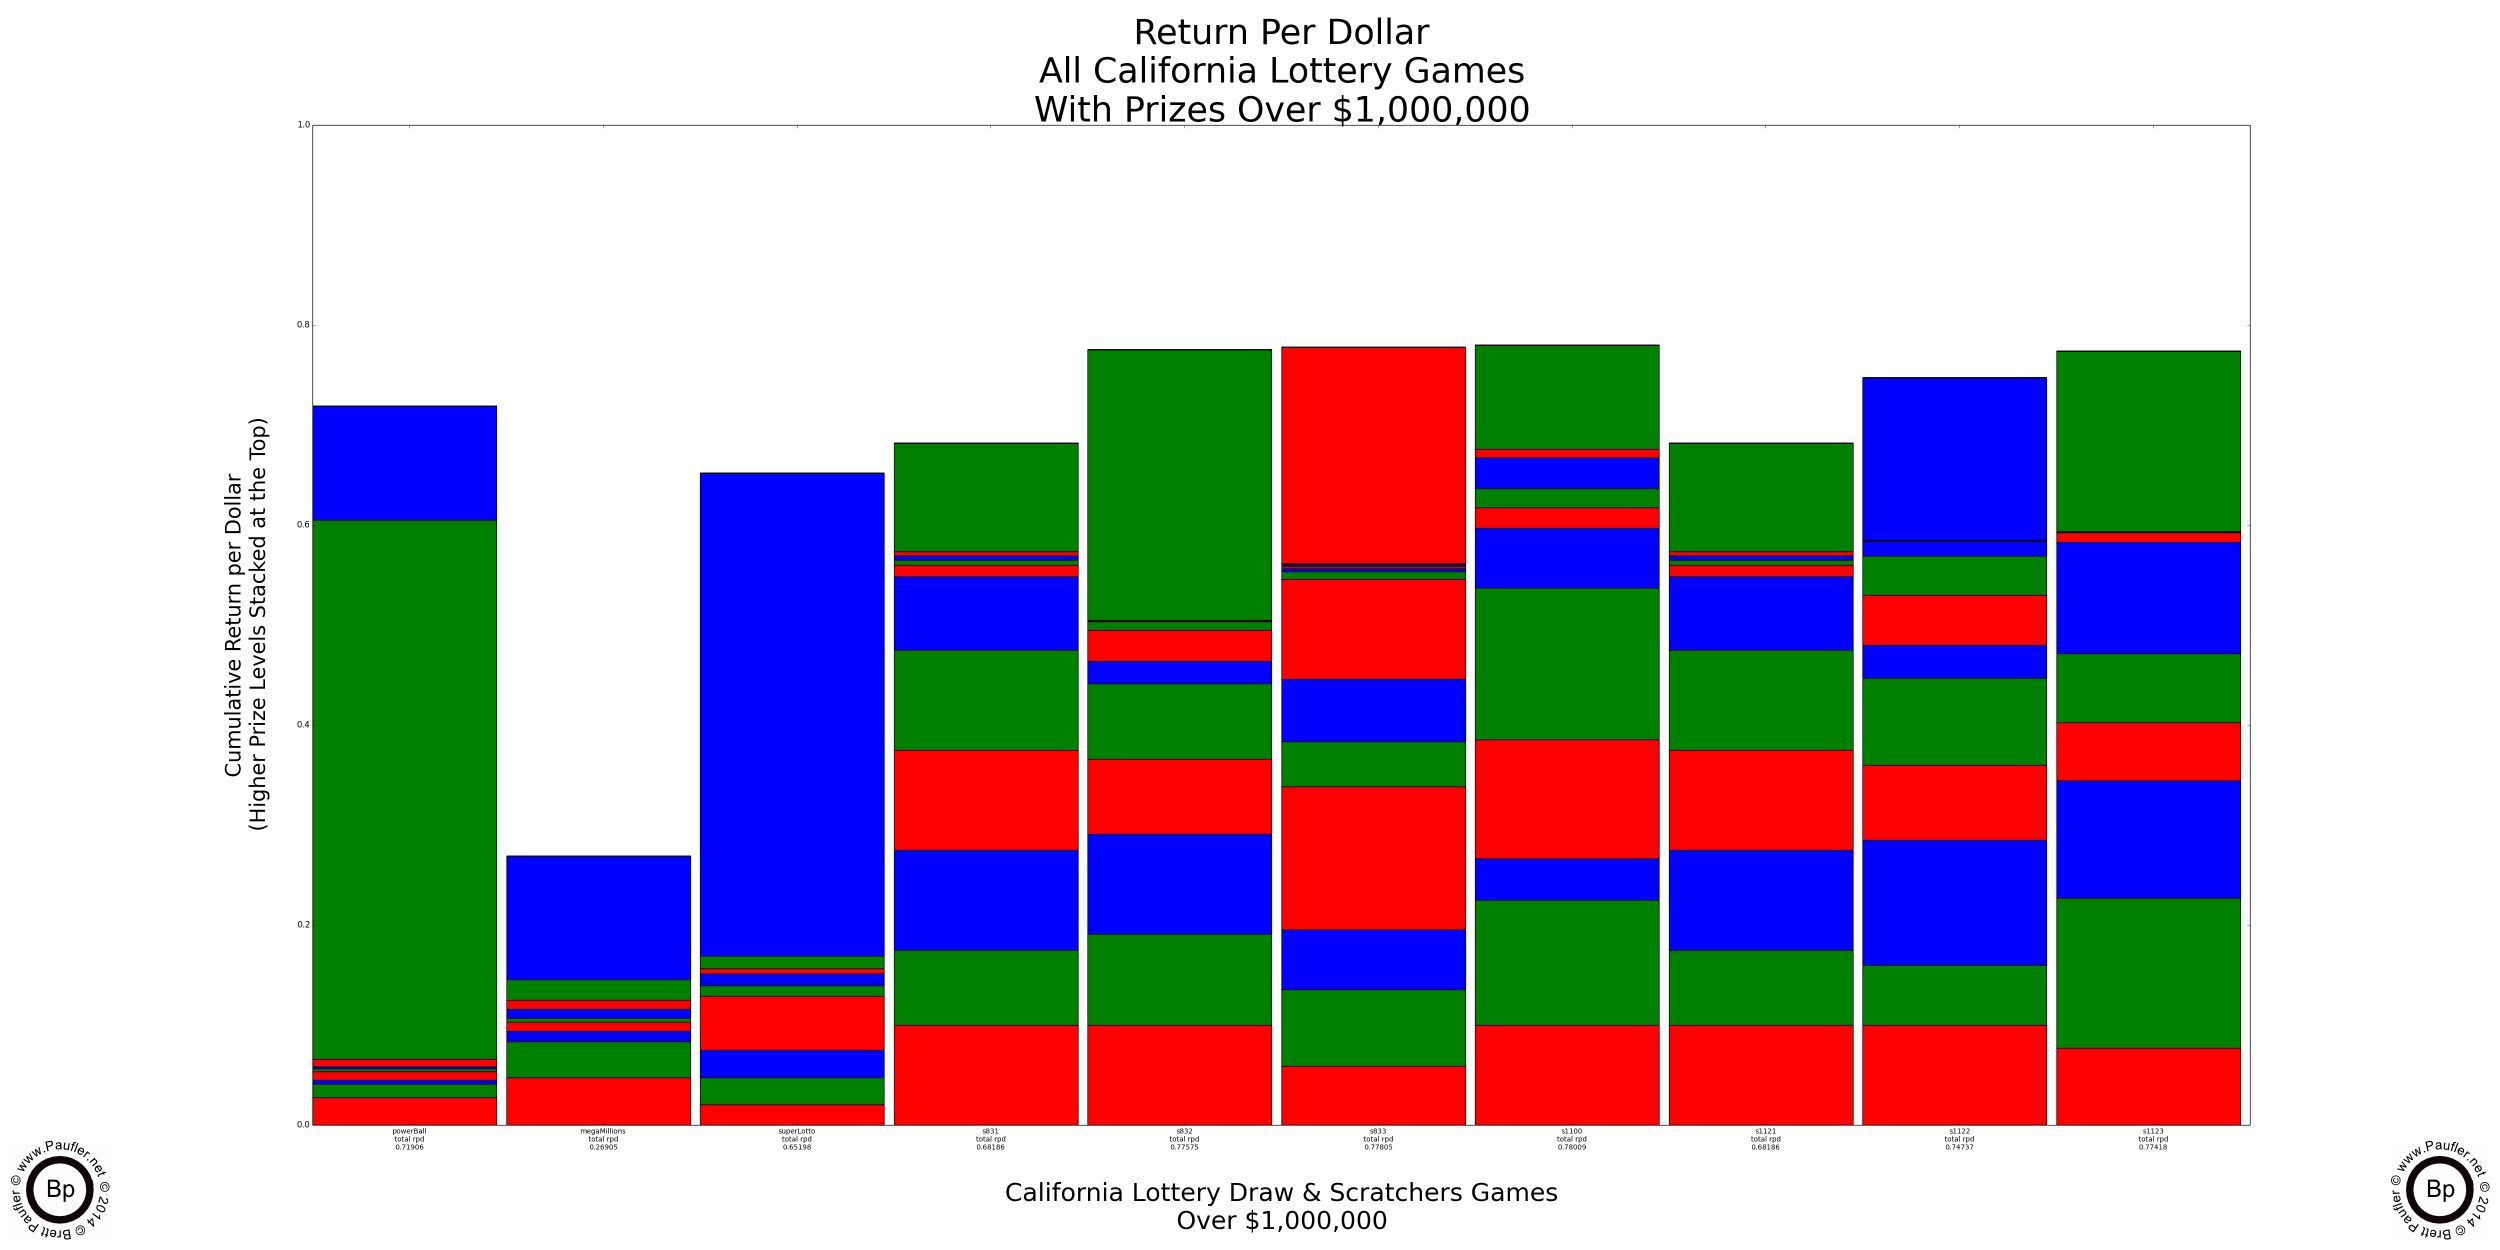
Once again, please note that most Scratchers have a Return per Dollar in the 0.60 - 0.80 range. I believe (but don't really know how to confirm this) that the Return per Dollar for Las Vegas slot machines is set by law at 0.80 or higher.
Please also note, the vertical extent of the second from top jackpot layer for the first game on the left (Power Ball). This is the second jackpot amount on Power Ball (at $5,500,000 for the 7-12-14 draw). While the top band on the third bar in is the Super Lotto jackpot (only at $20,000,000 for this draw). Since both of these prize amounts are parimutuel and increase slowly over time, if a jackpot goes long enough without anyone winning, the Return per Dollar would go over 1.0, at which point the game would become a Positive Odds Bet in that the total expected payout would then exceed the cost of the wager (a fact, which much like everything else on this page, does not take into account that there may be more than one jackpot winner).
Return per Dollar Lower Amounts Lumped Together
At some point, a low prize is nothing more than a free spin and should not be treated differently.
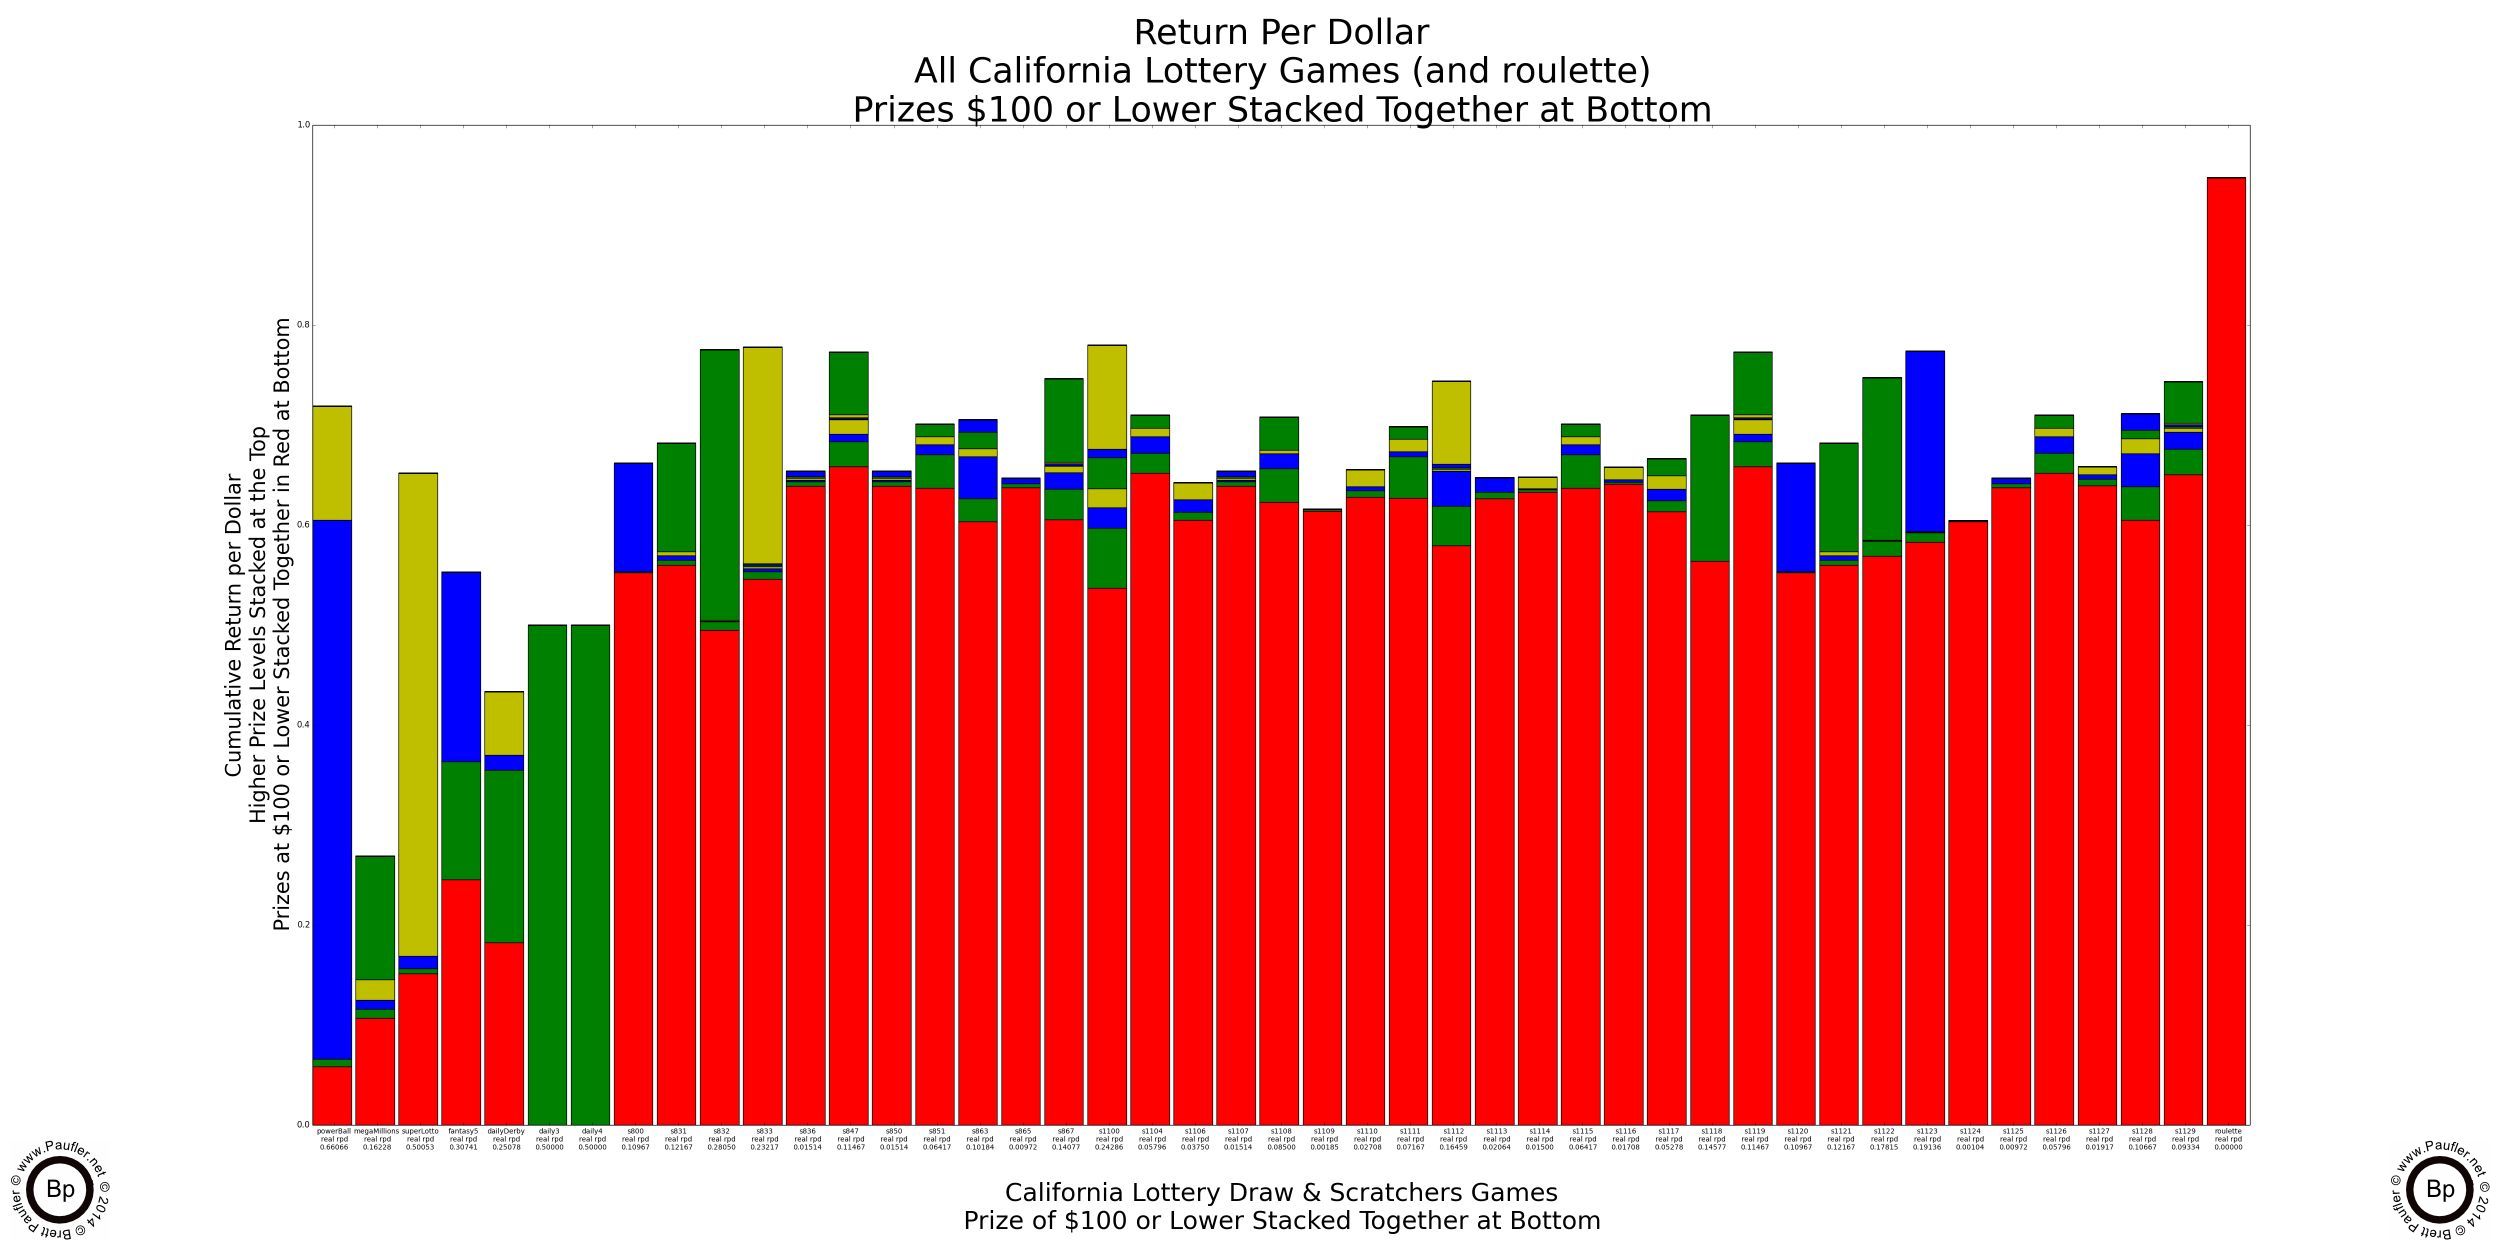
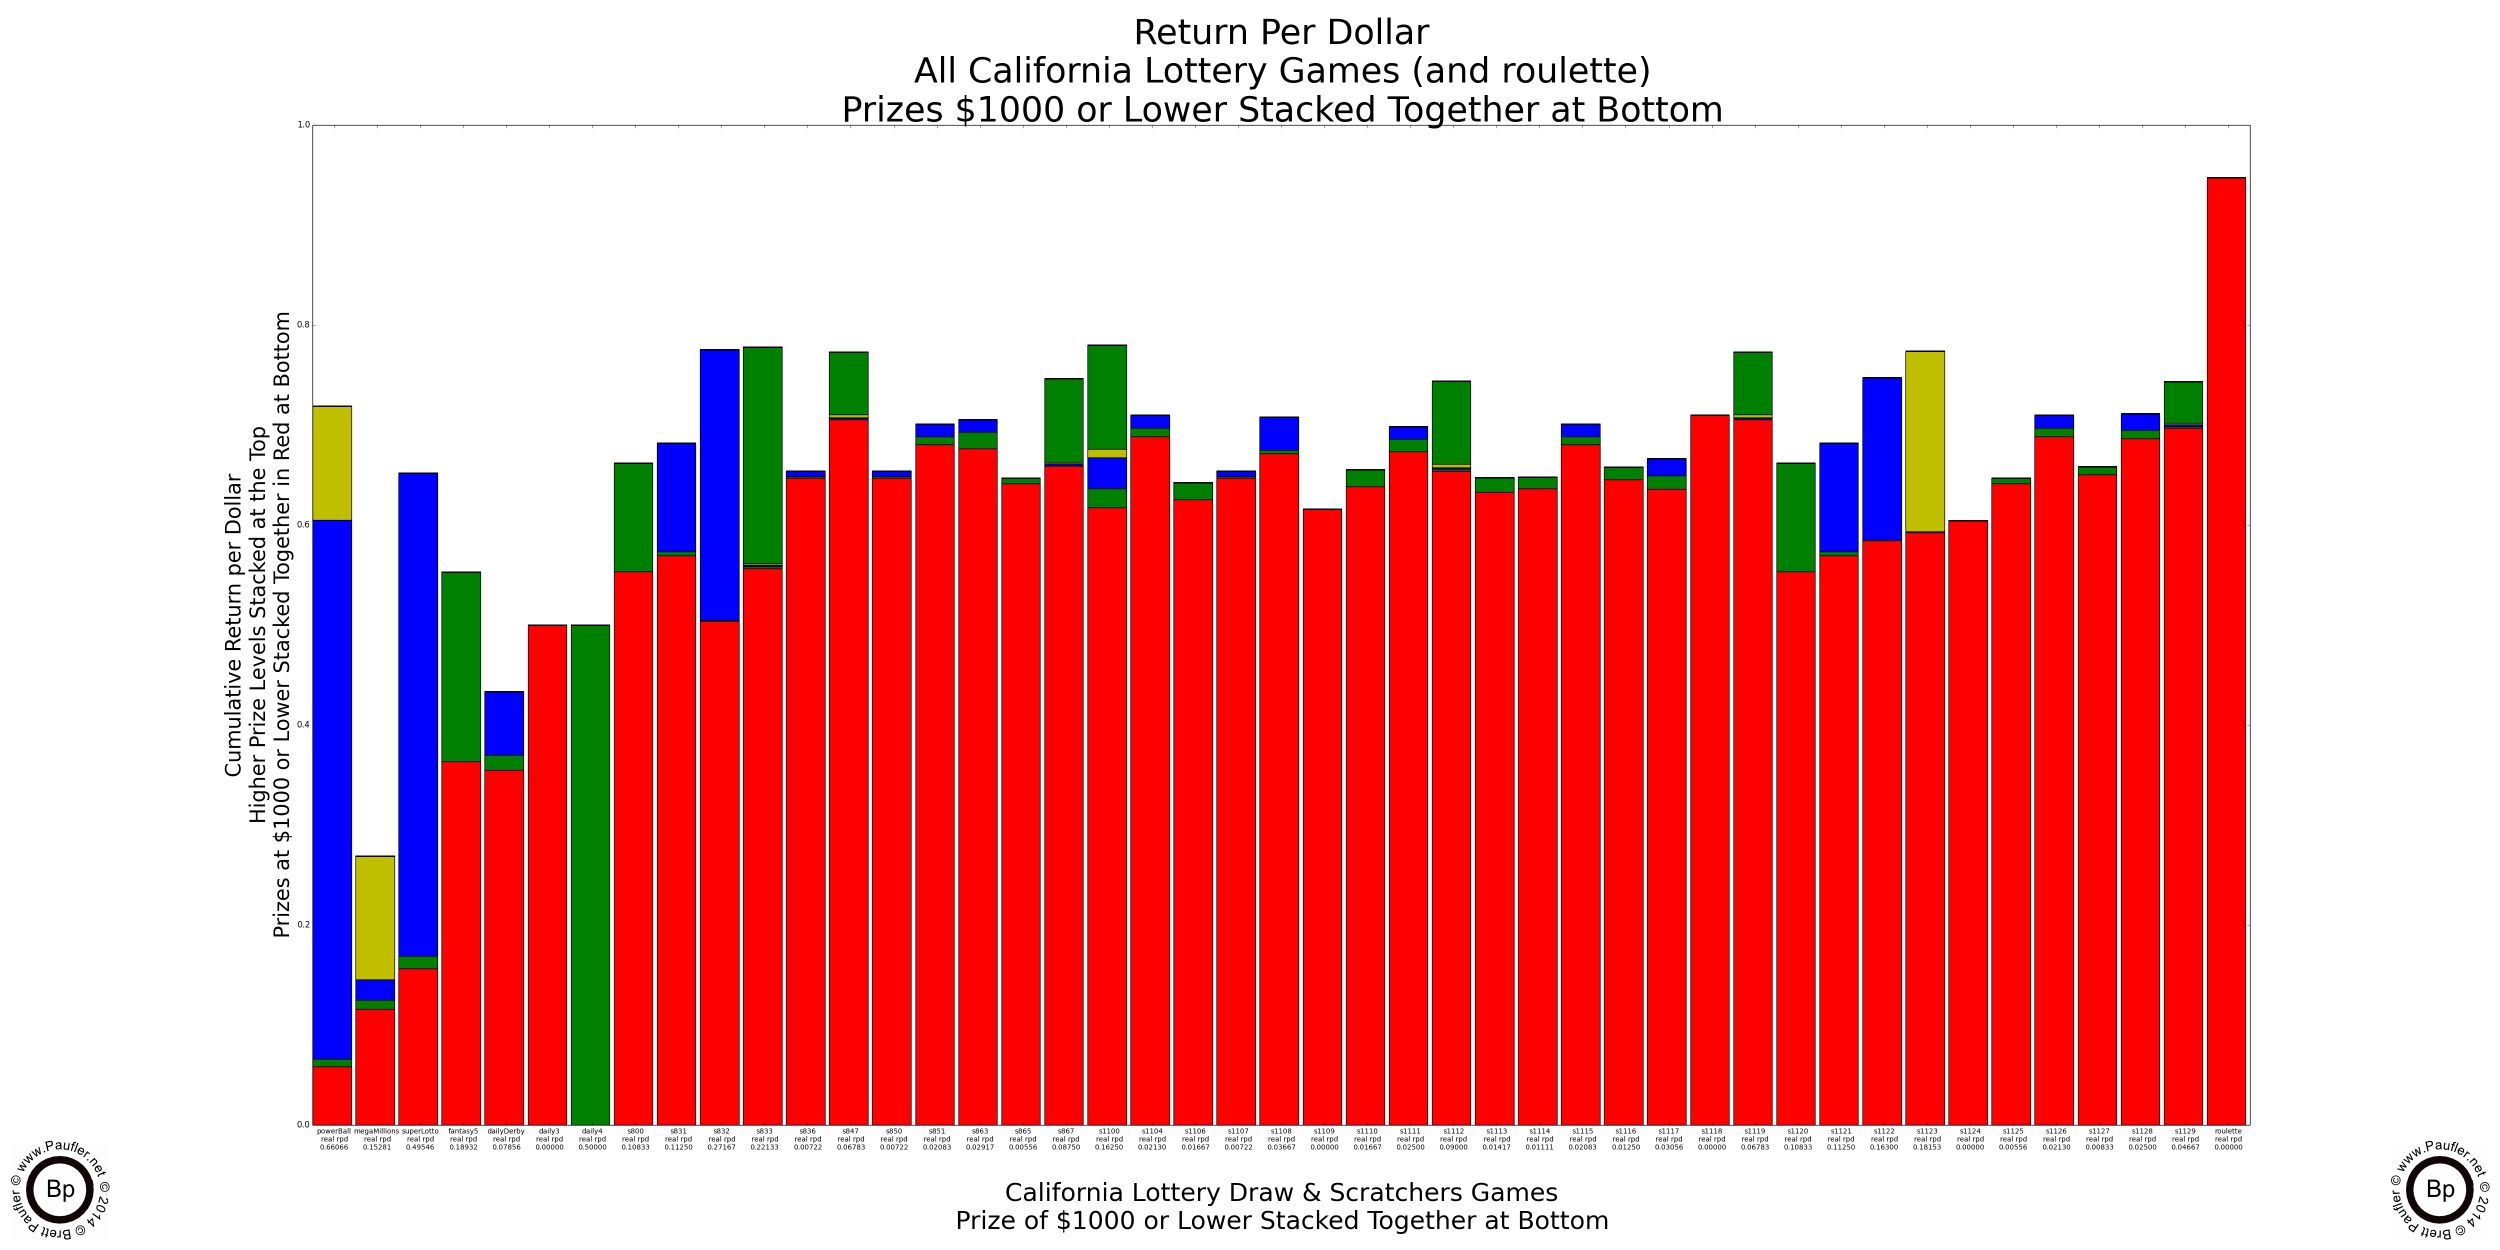
Rather ironically, there's not much difference in whether one lumps all the prizes under $100 or those under $1,000 all together. It goes to show how few prizes between those two levels there actually are.
'The Drop' is gambling lingo for how much a player 'drops' at a game: that is, how much they lose and leave behind at the table. I've been told that the typical 'drop' at an average table game (craps, blackjack) in Las Vegas exceeds 80% (if a player breaks a $100 bill, $80 is going to stay at the table... on average). And there's no reason to believe that the same doesn't hold true for the lottery as the typical player is not seeking to double or triple their money, but is looking for a much (much-much-much) larger win and will keep on playing until they either win or lose it all. Which is really just another way of saying, the typical gambler (I will claim to be no exception), simply plays until they lose.
What this means is that most of the money the lottery pays out (all the area in red) is in free spins: low level prizes that the average (serious) gambler (which by default means the average lottery ticket purchaser) will simply use to buy more tickets. So, treating them as 'winnings' is misleading. They are free spins. They are a means to an end. But they are not an end in themselves.
Or look at it this way. You know when they say 'the lottery is for entertainment purposes' (or something like that)? Well, all that stuff in red is the entertainment. It should be noted that the draw games on the left have less red (less scratching, less entertainment in them), and by the same extrapolation, they are where the real gambling action takes place.
The games with the straight vertical lines are the Daily 3 and Daily 4: one prize, no bands. Not bad propositions if one is seeking either a 500x or 5,000x return on their investment (provided one allows that in the preceding the word investment is on par with swampland in Florida).
Anyway, this is an article about gambling, how to win, increase one's odds, and so on, and not how to have a good time scratching off a pile of tickets. For me, any ticket worth less than $100 is going to go straight back into the game. And so, treating is like anything else just doesn't make any sense.
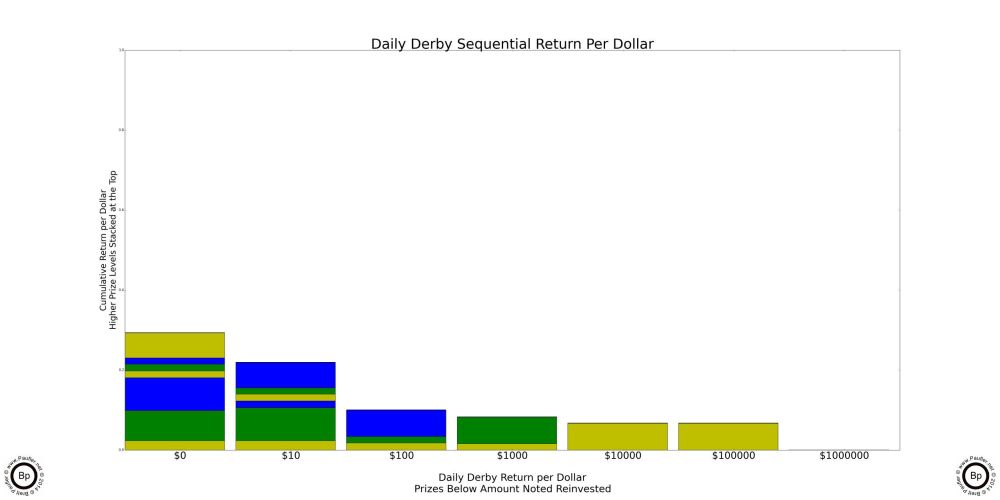
Return per Dollar Lower Level Prizes Reinvested
If enlarged, all that text on these graphs is readable (by me, at least).
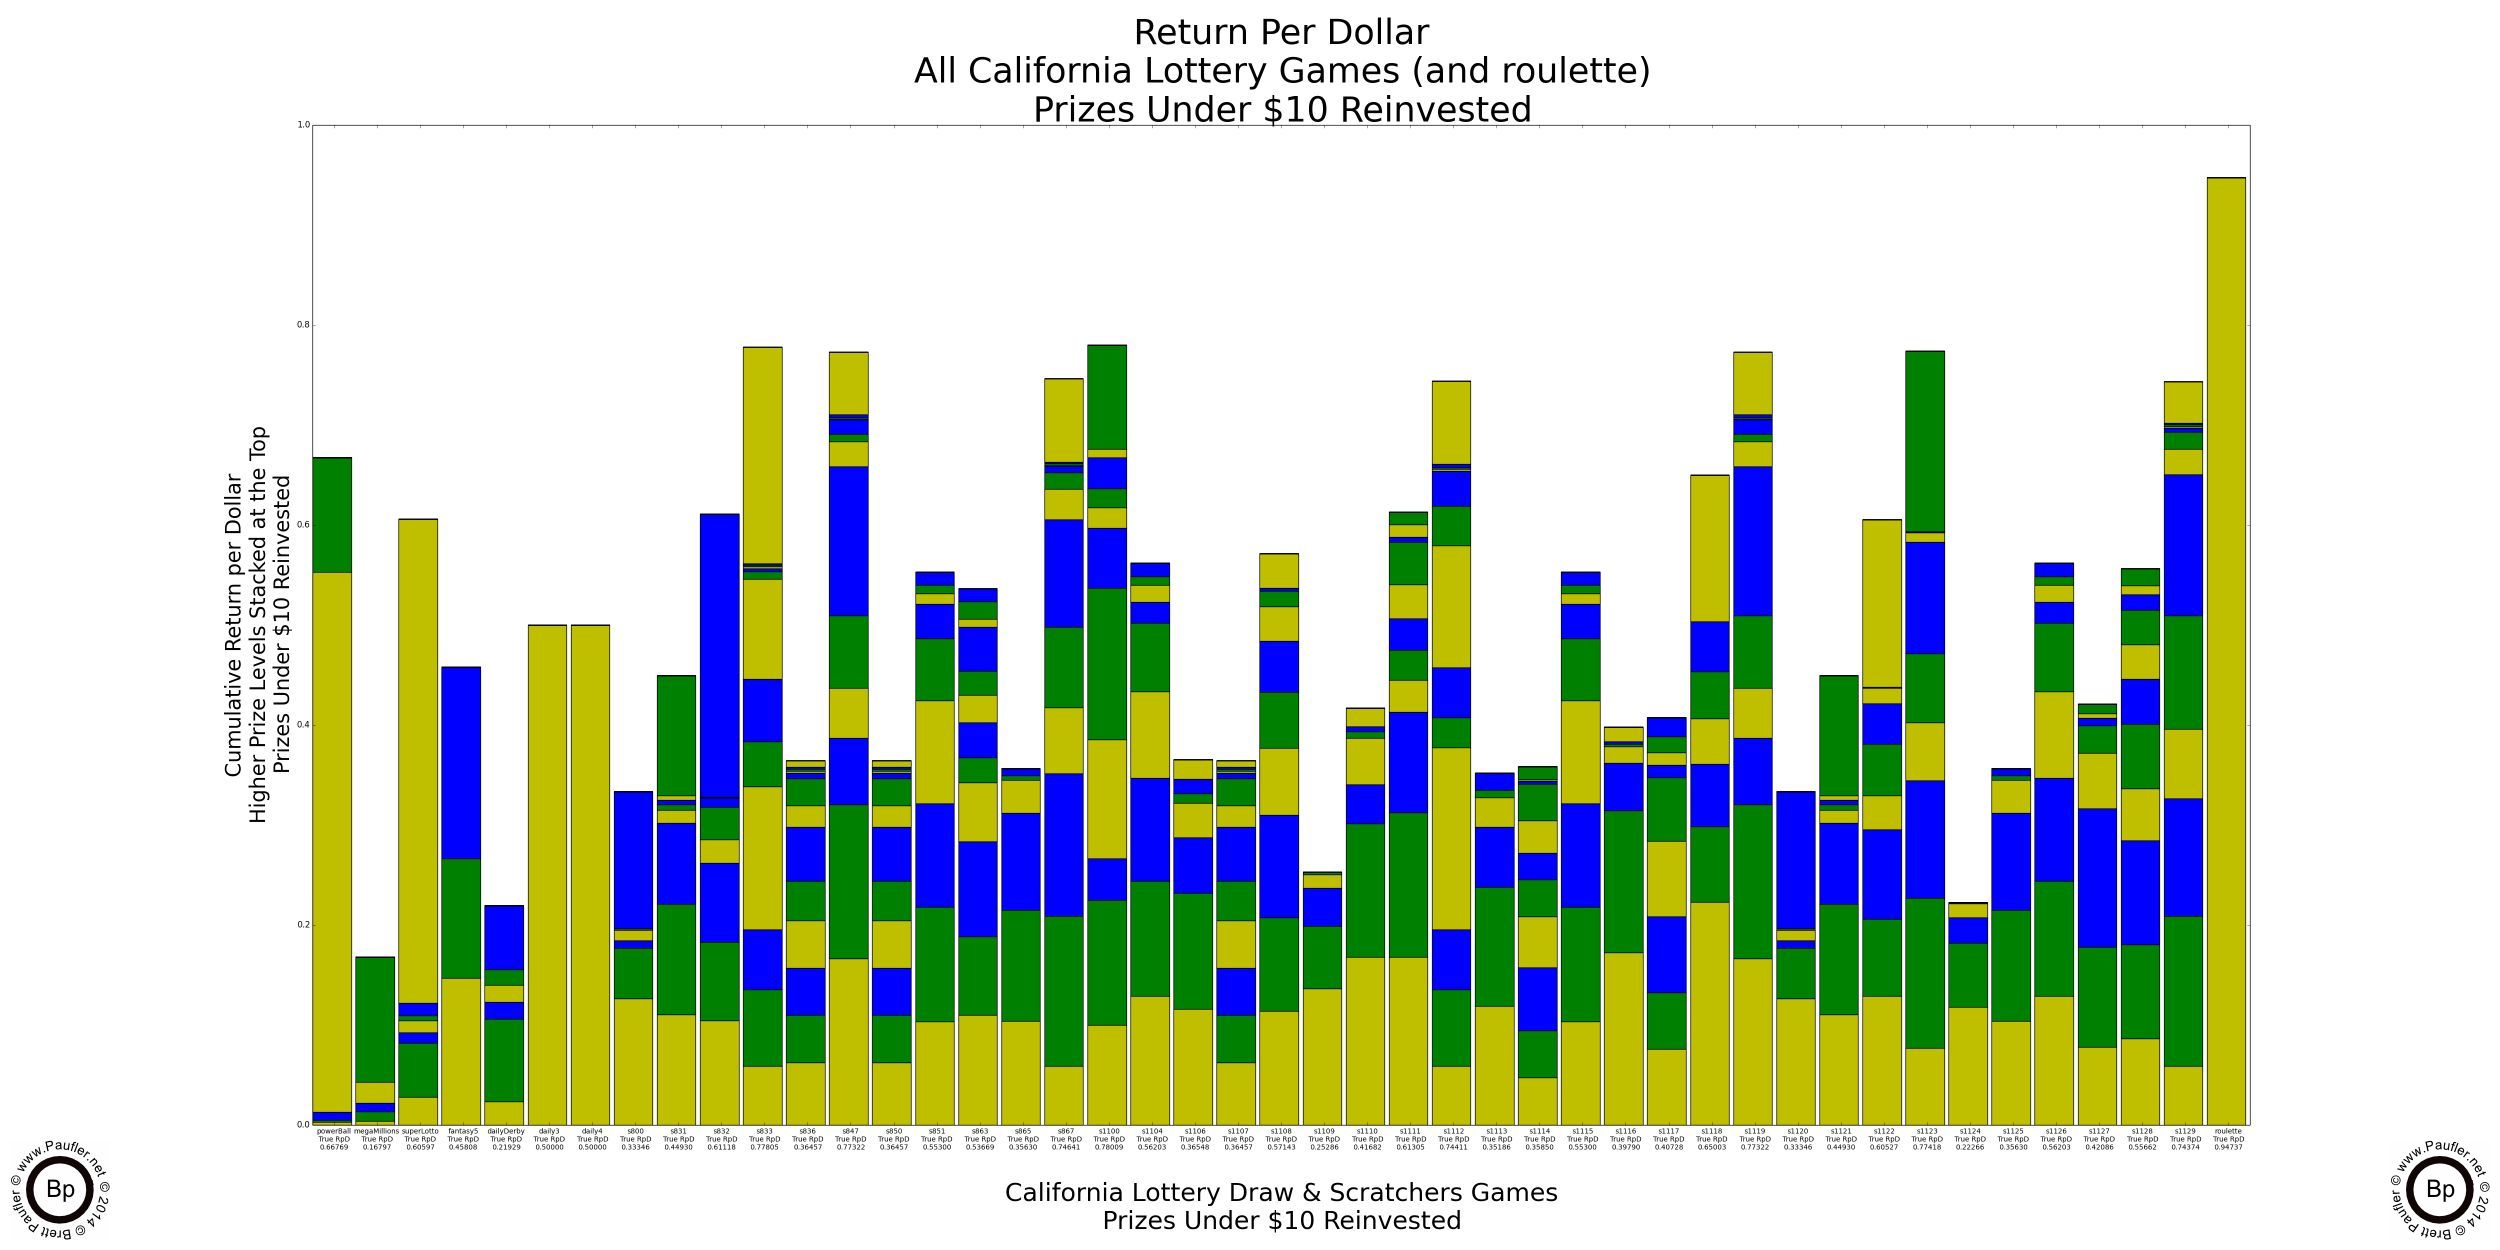
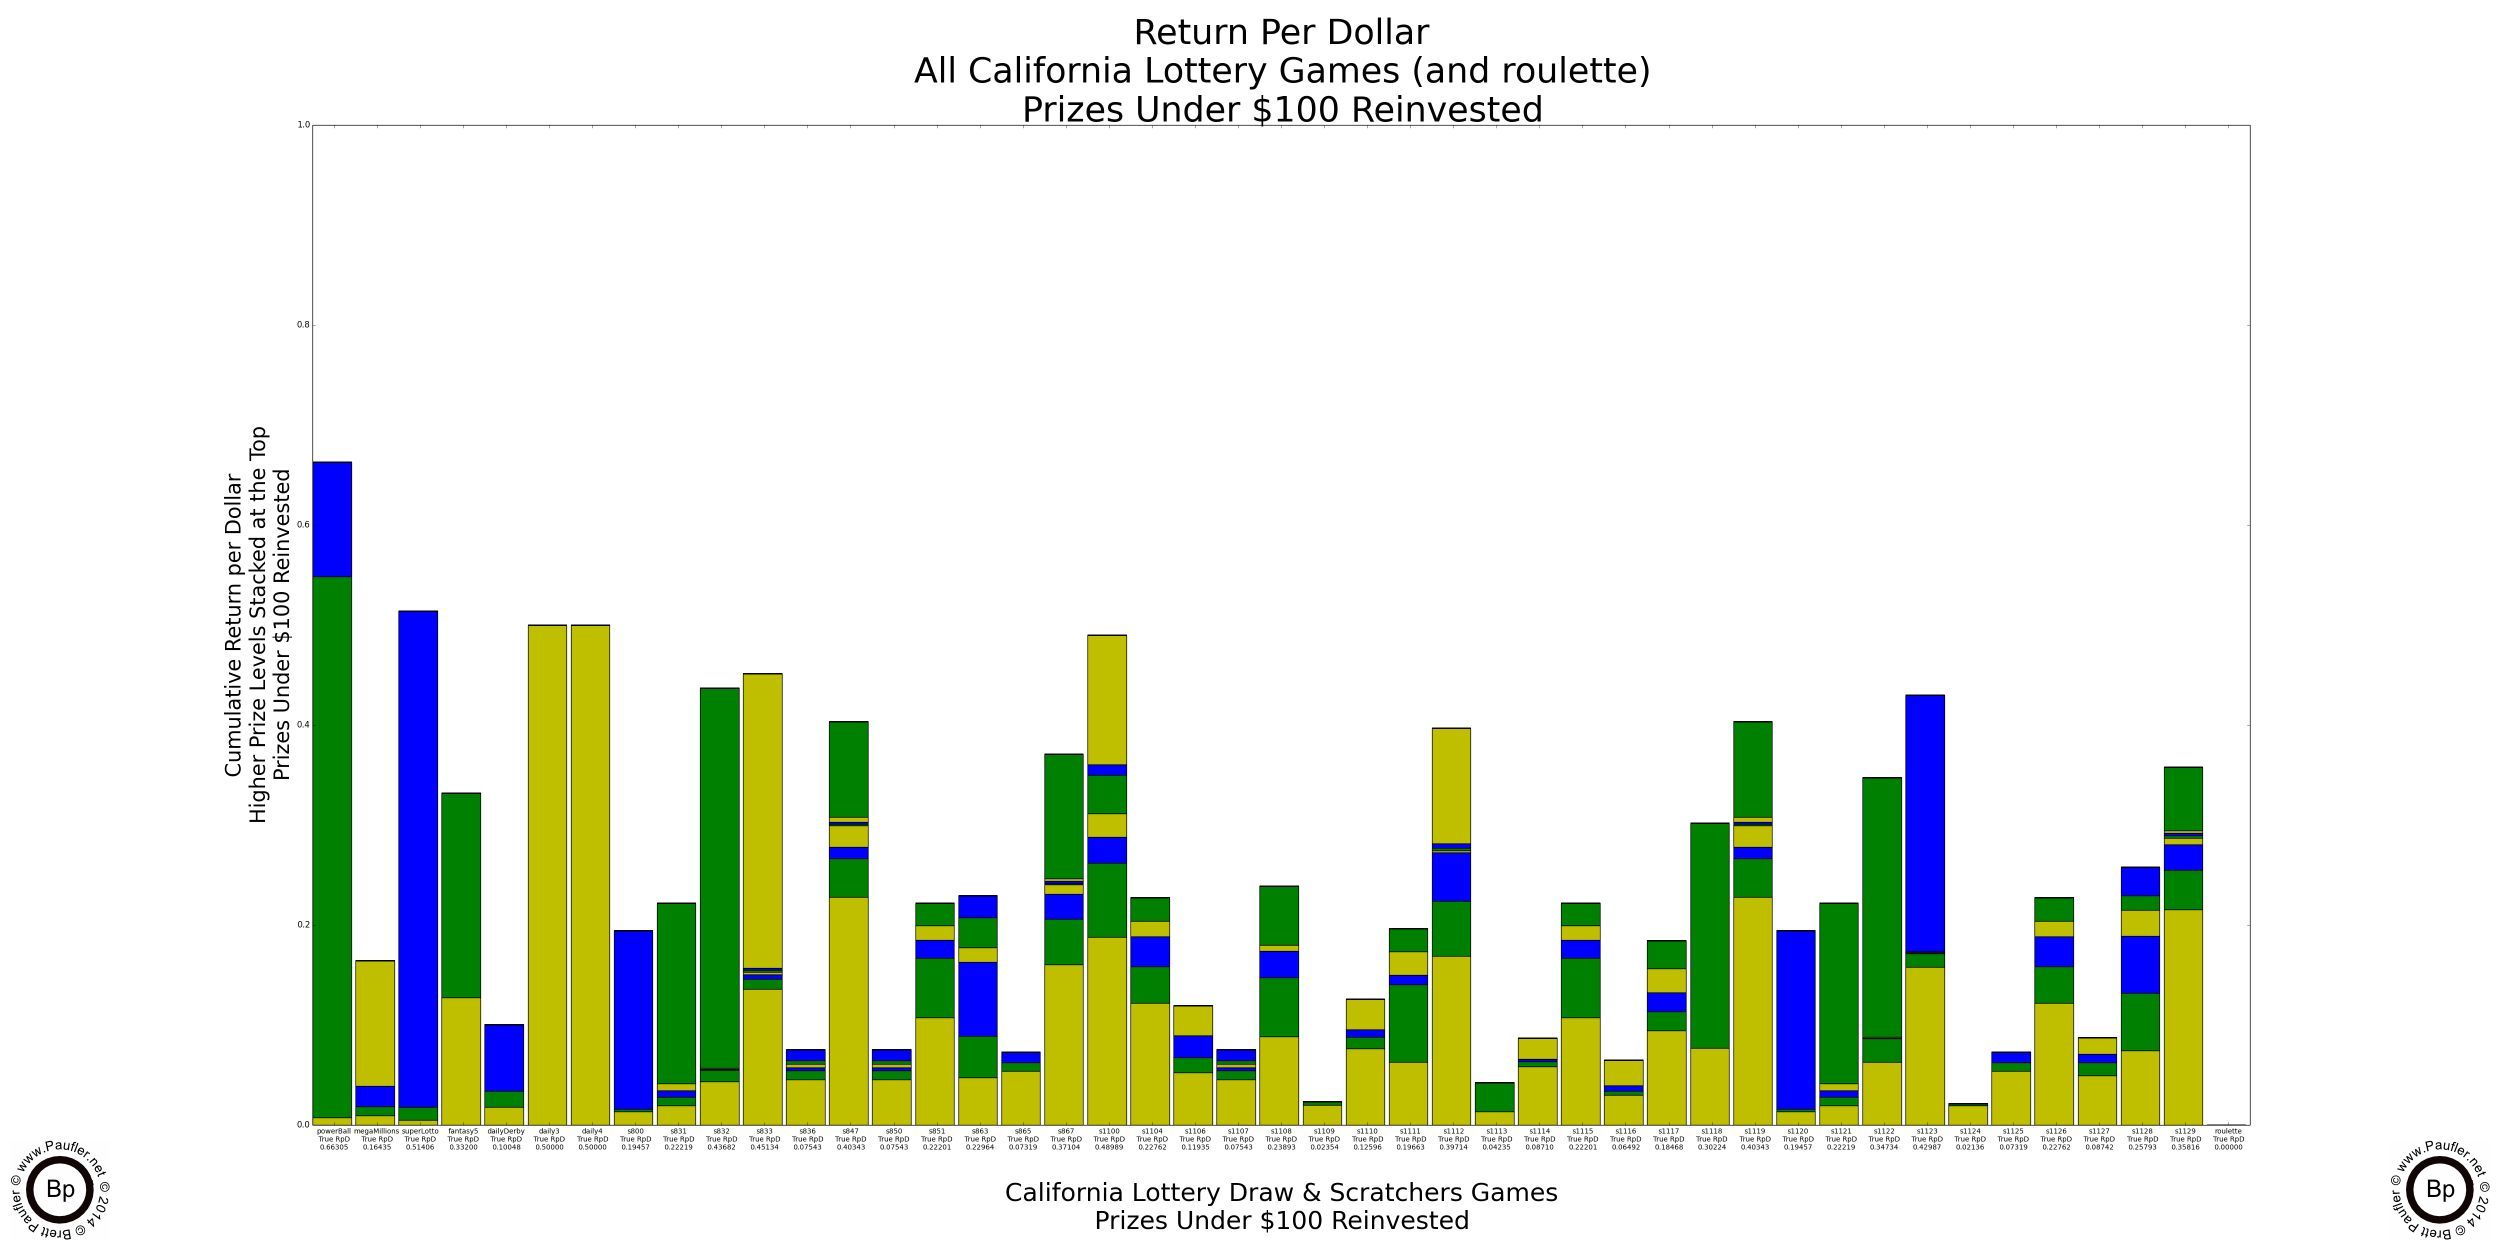
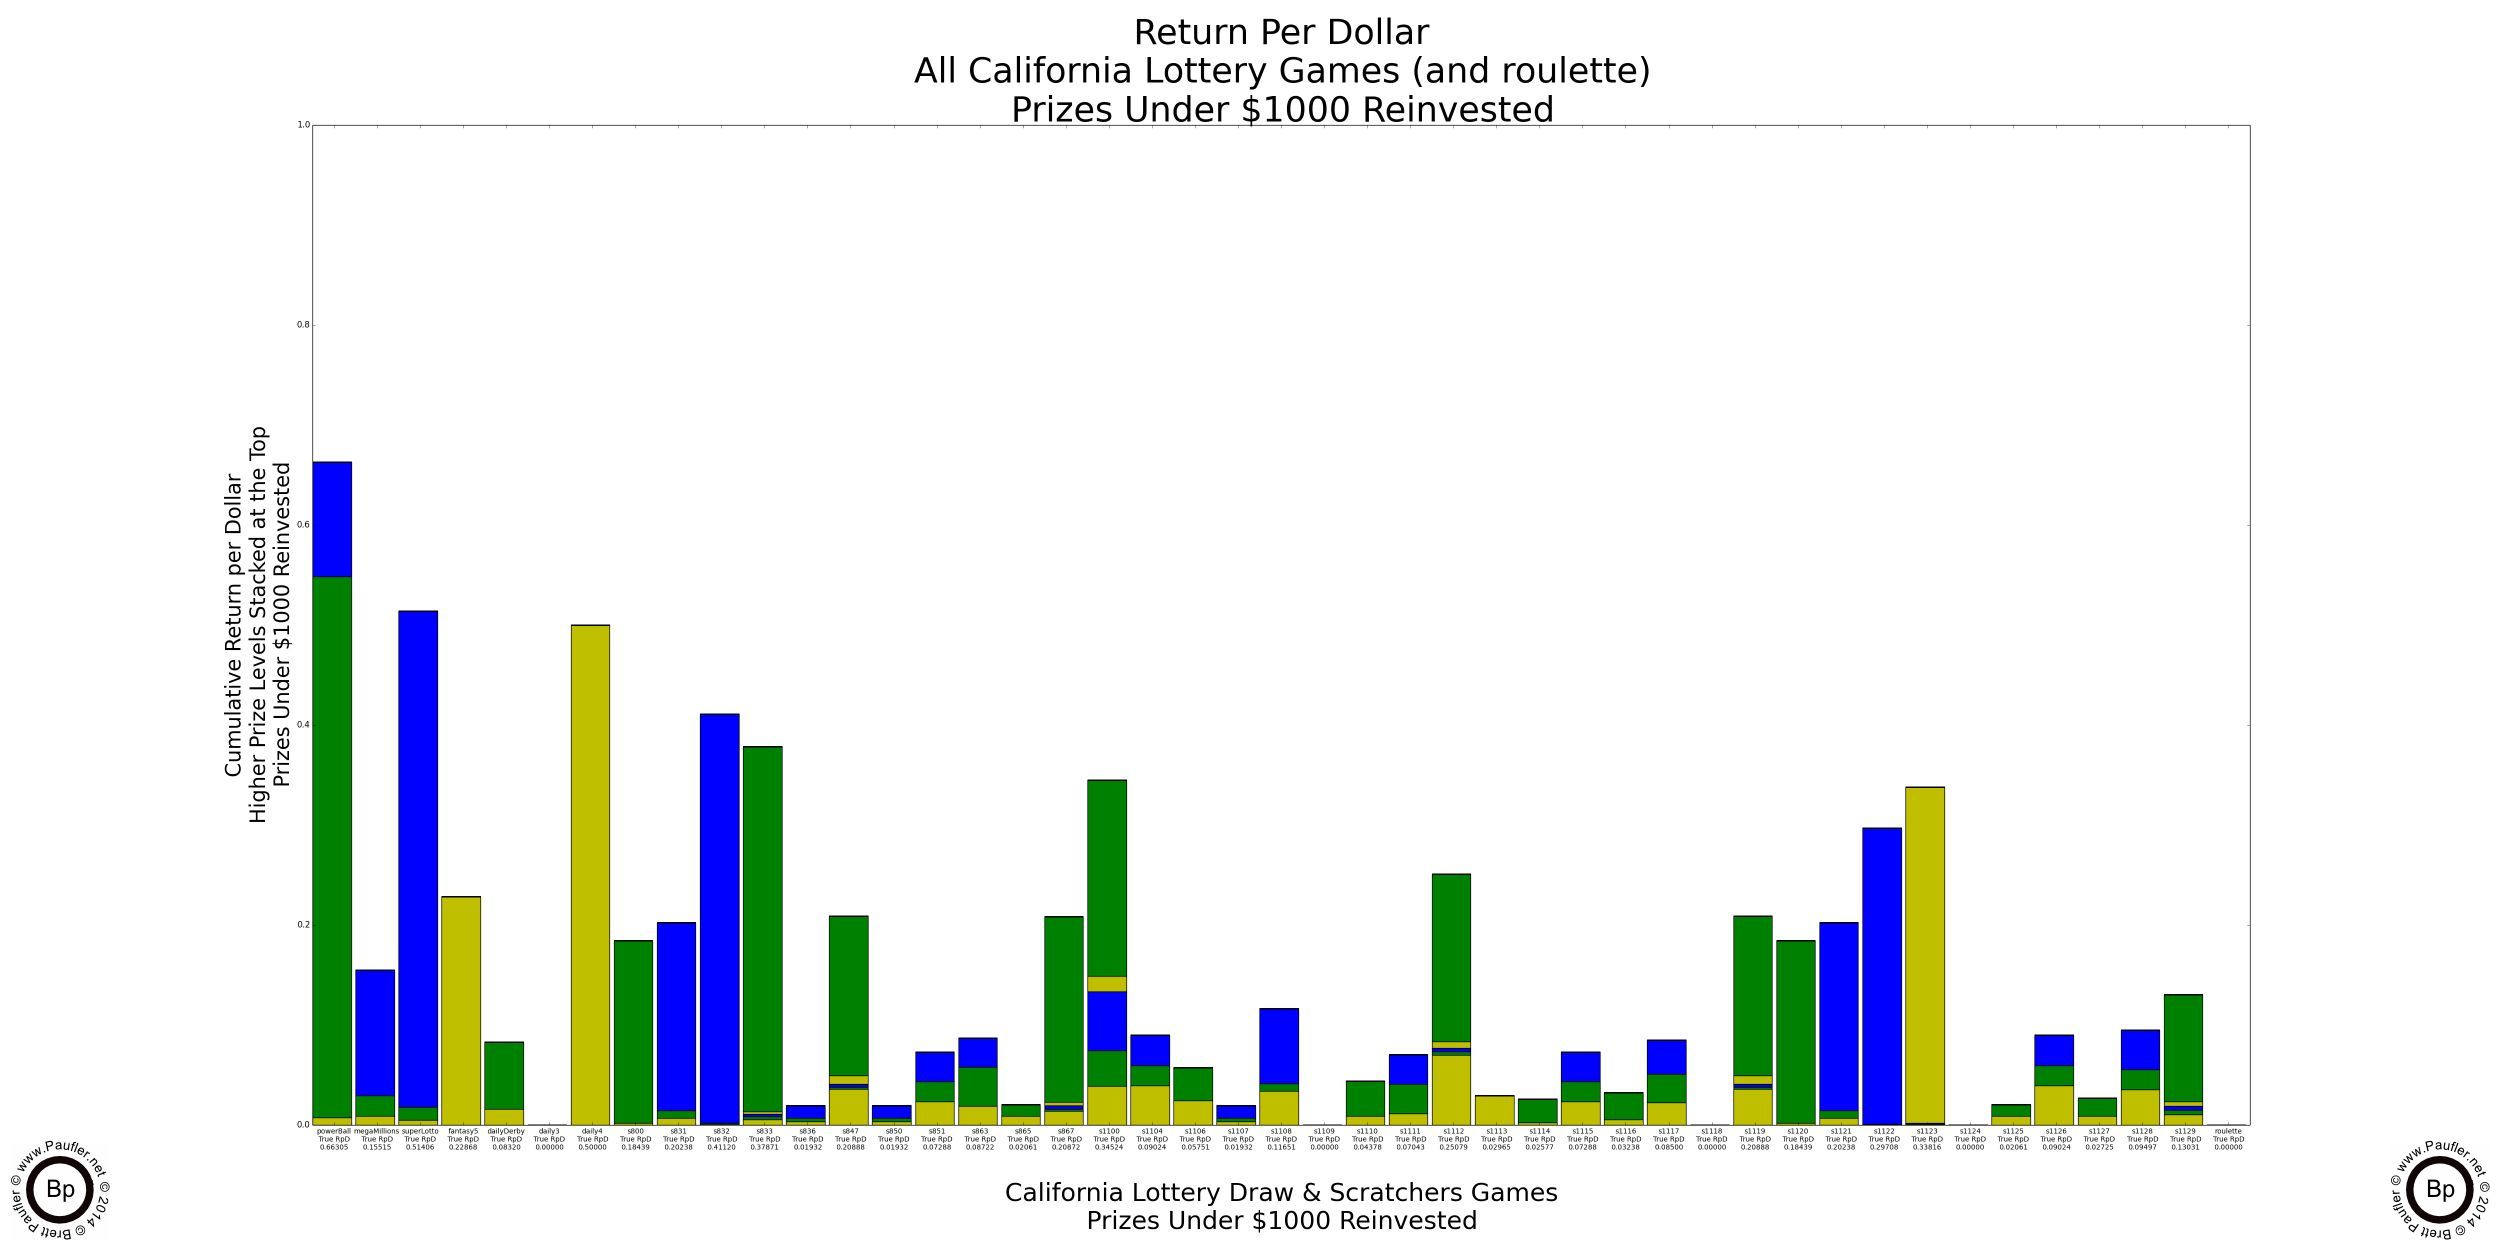
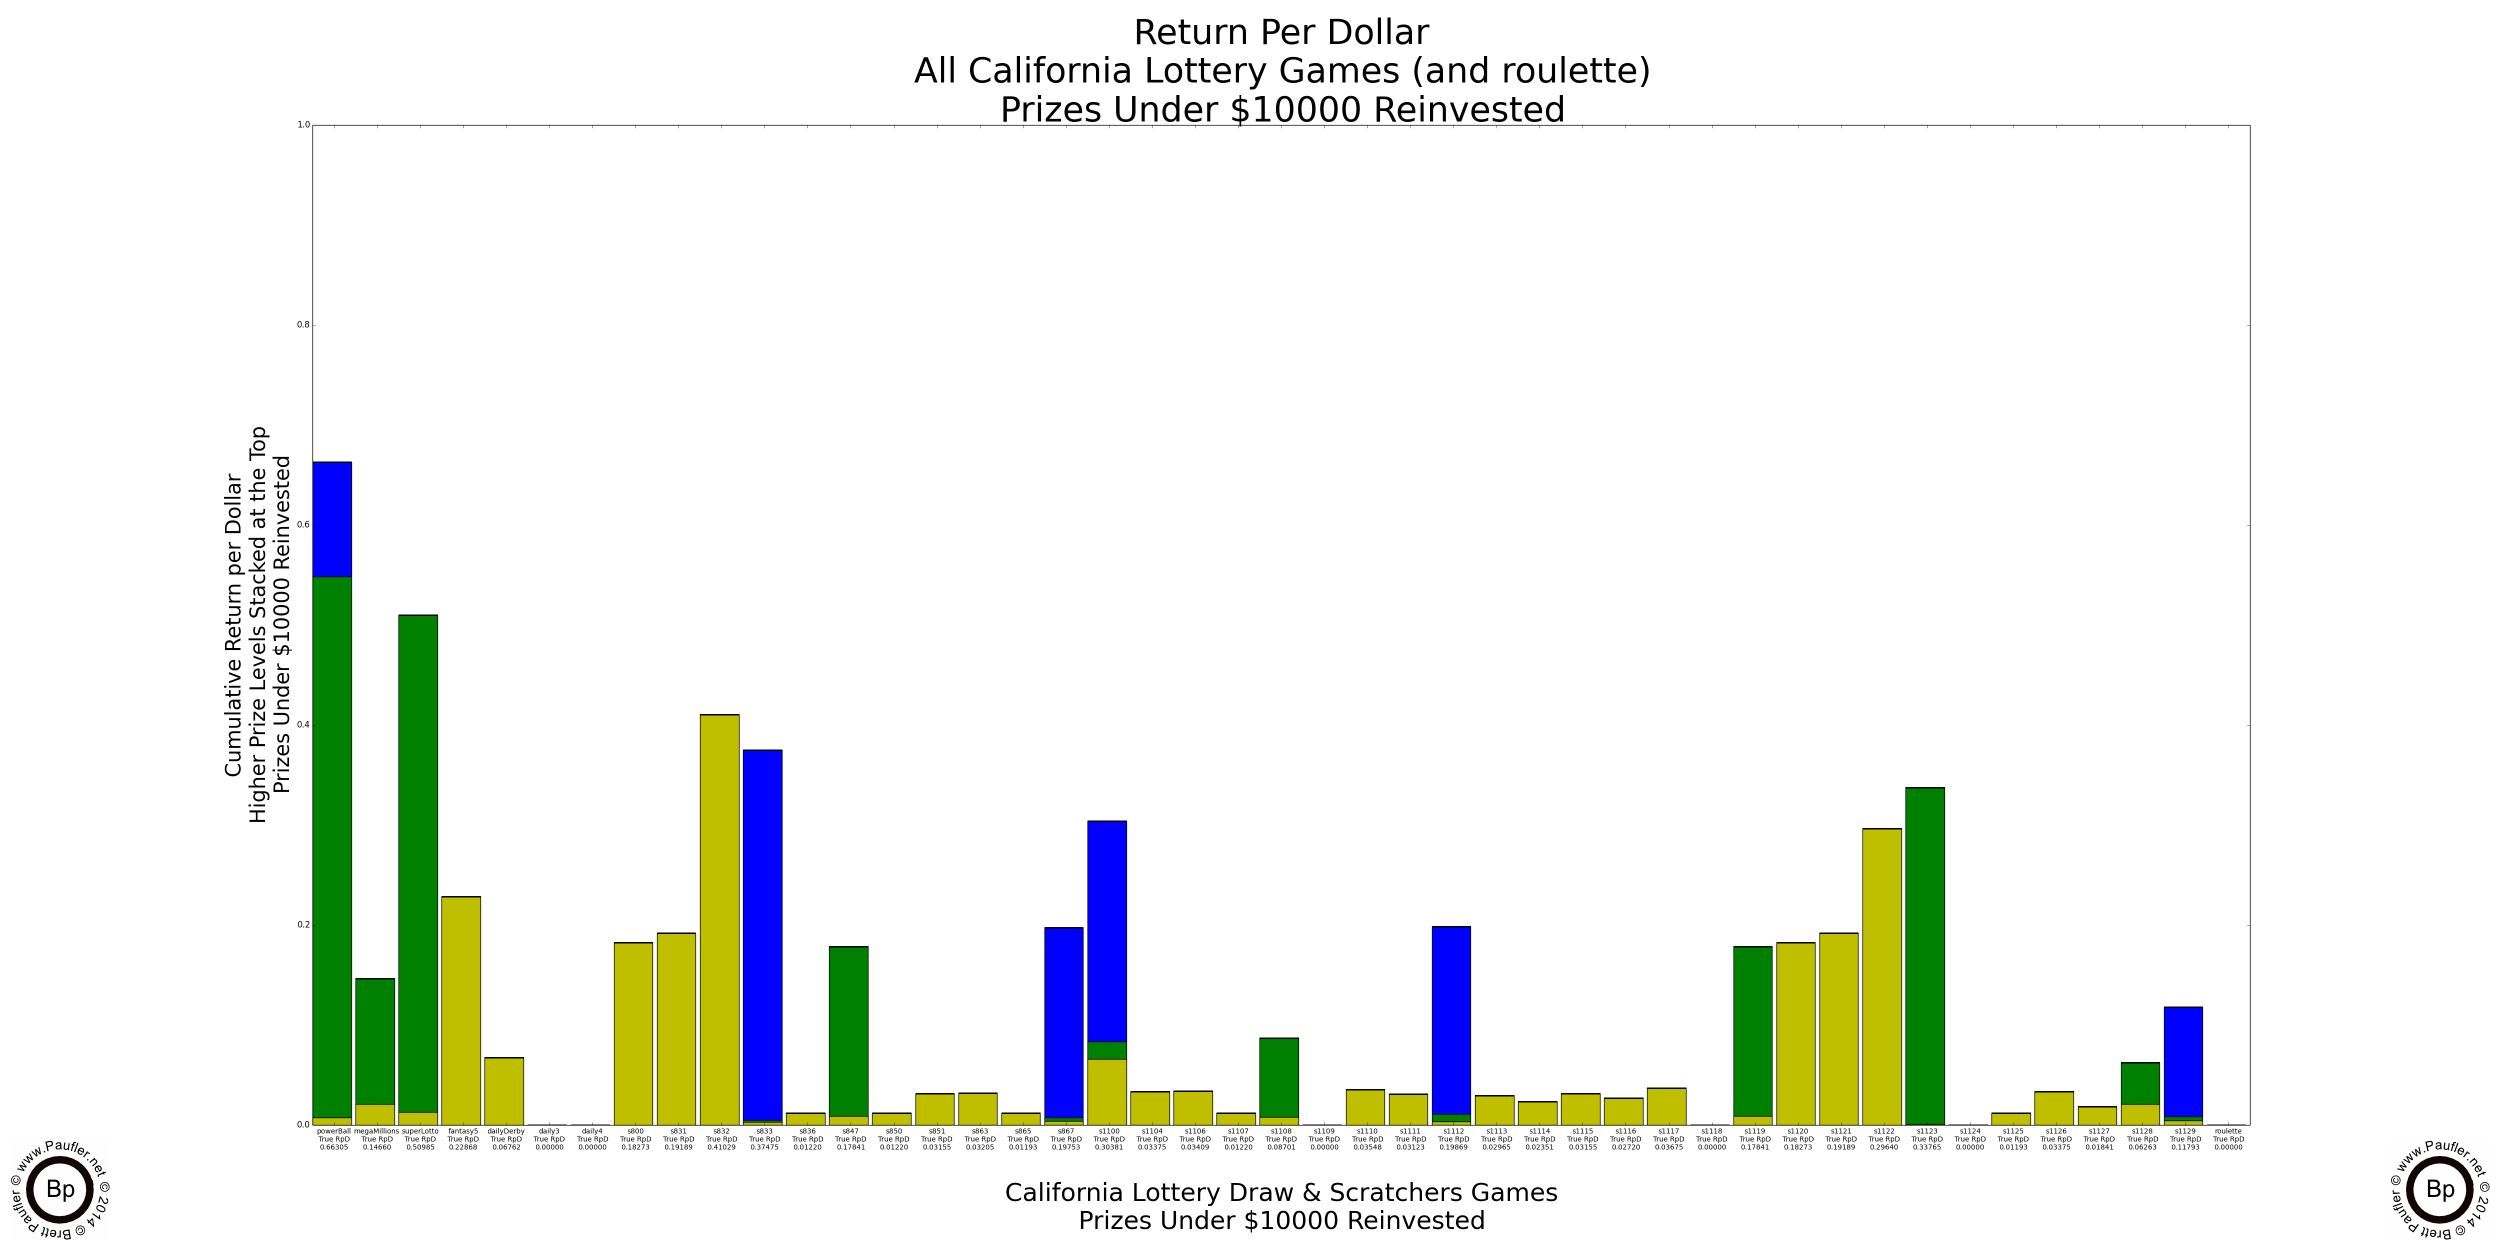
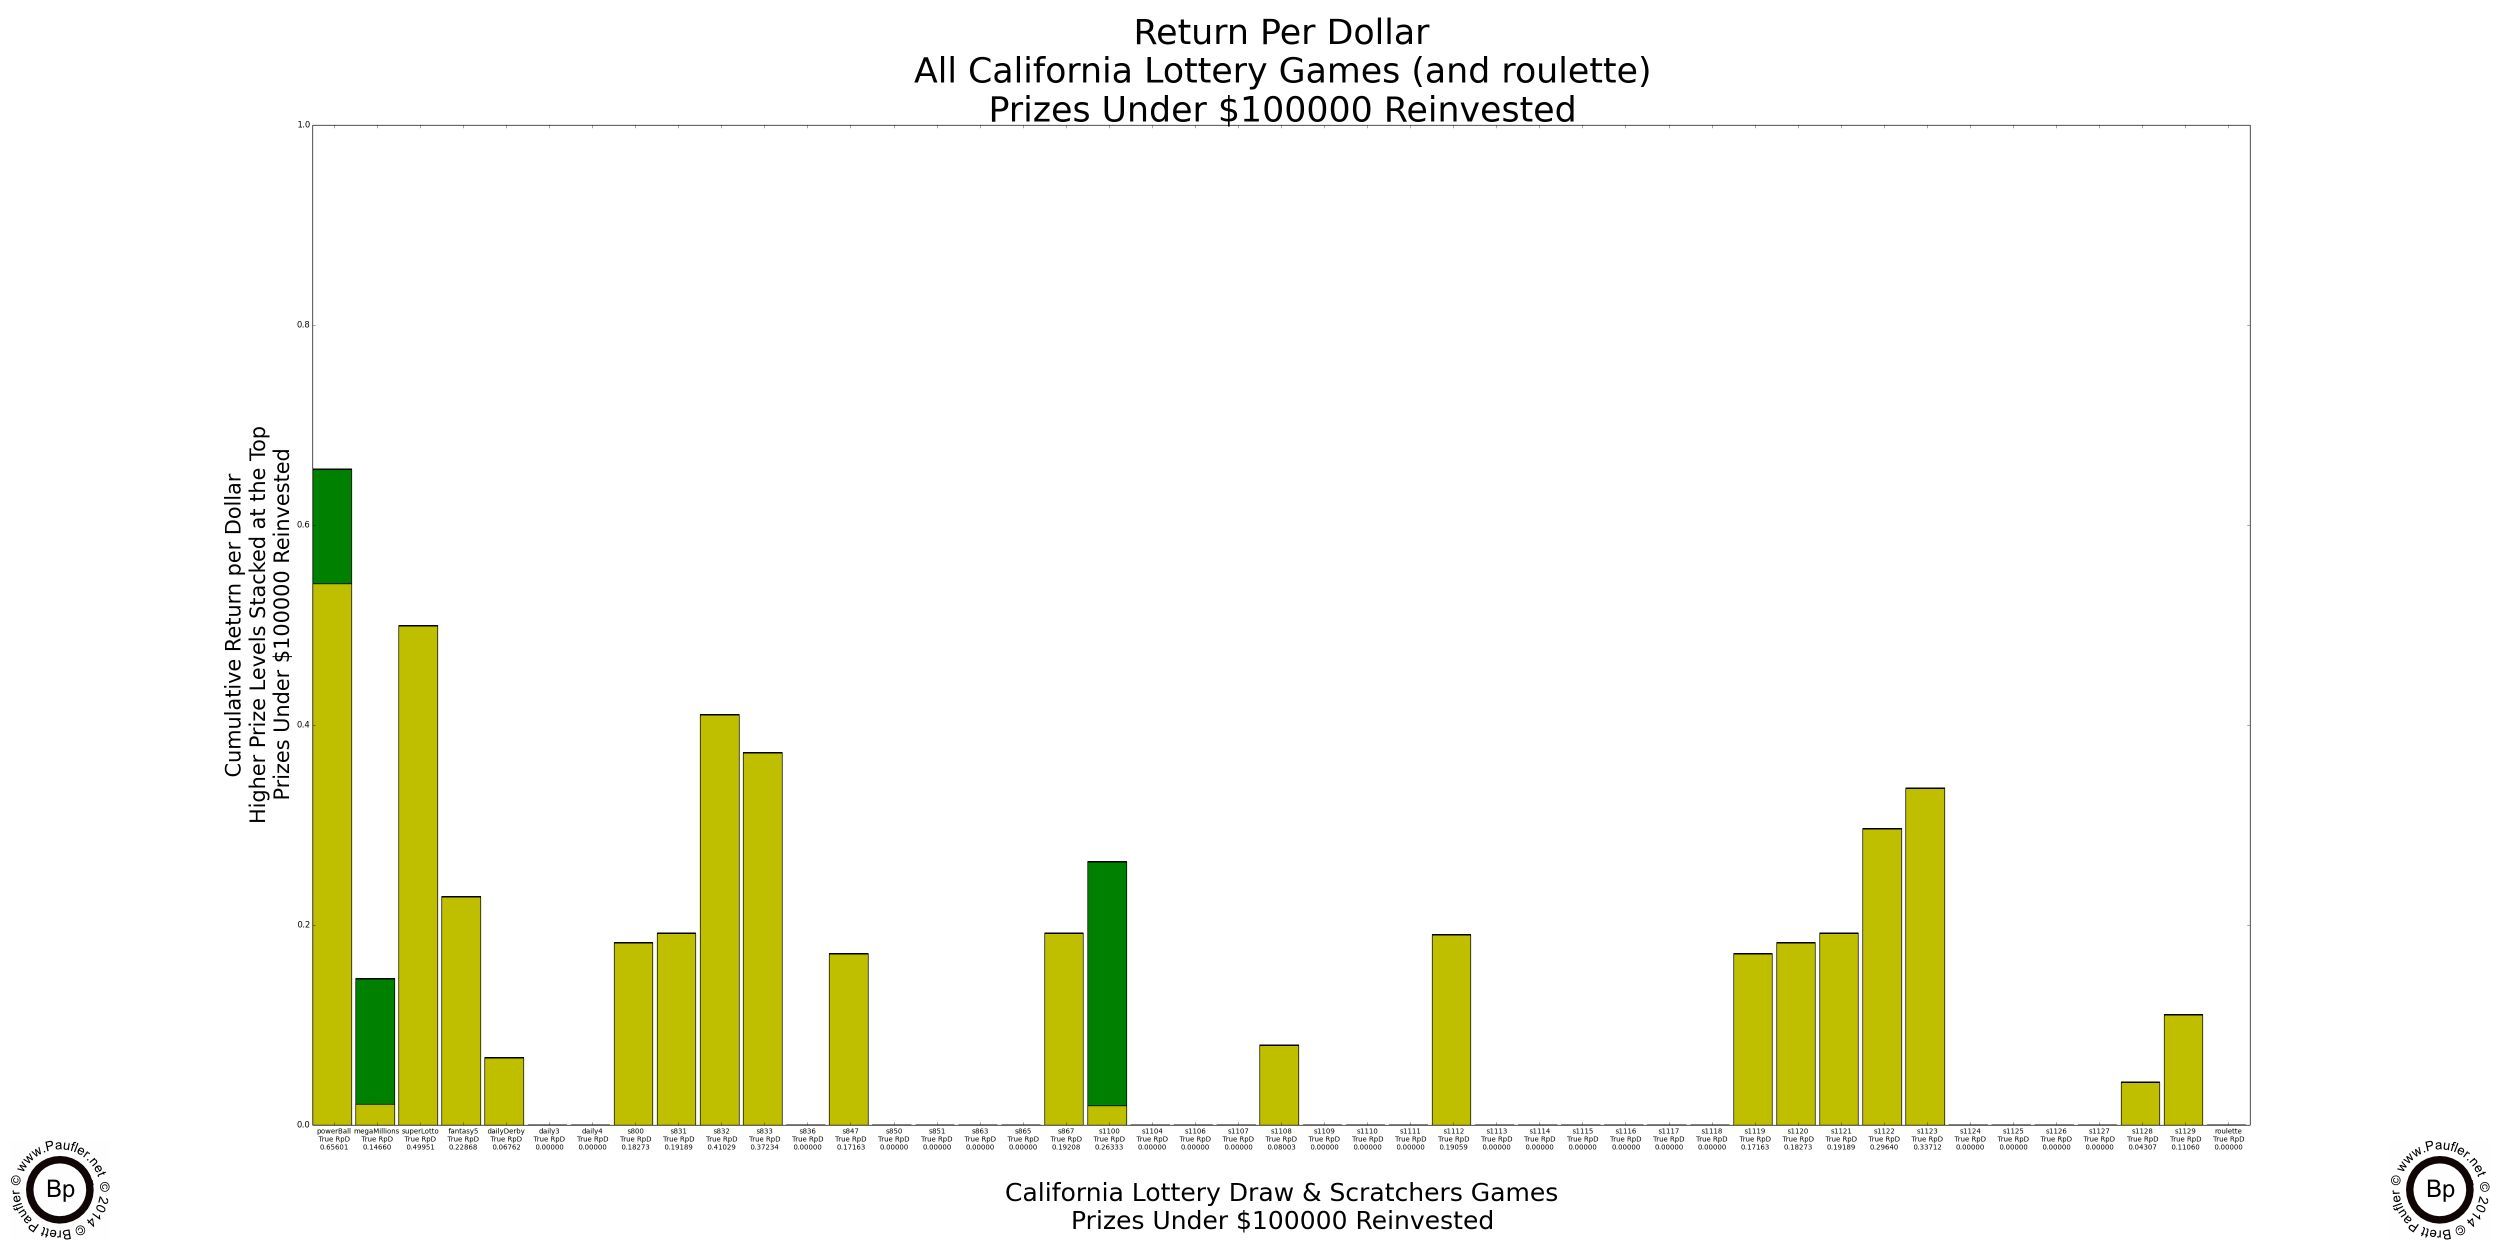
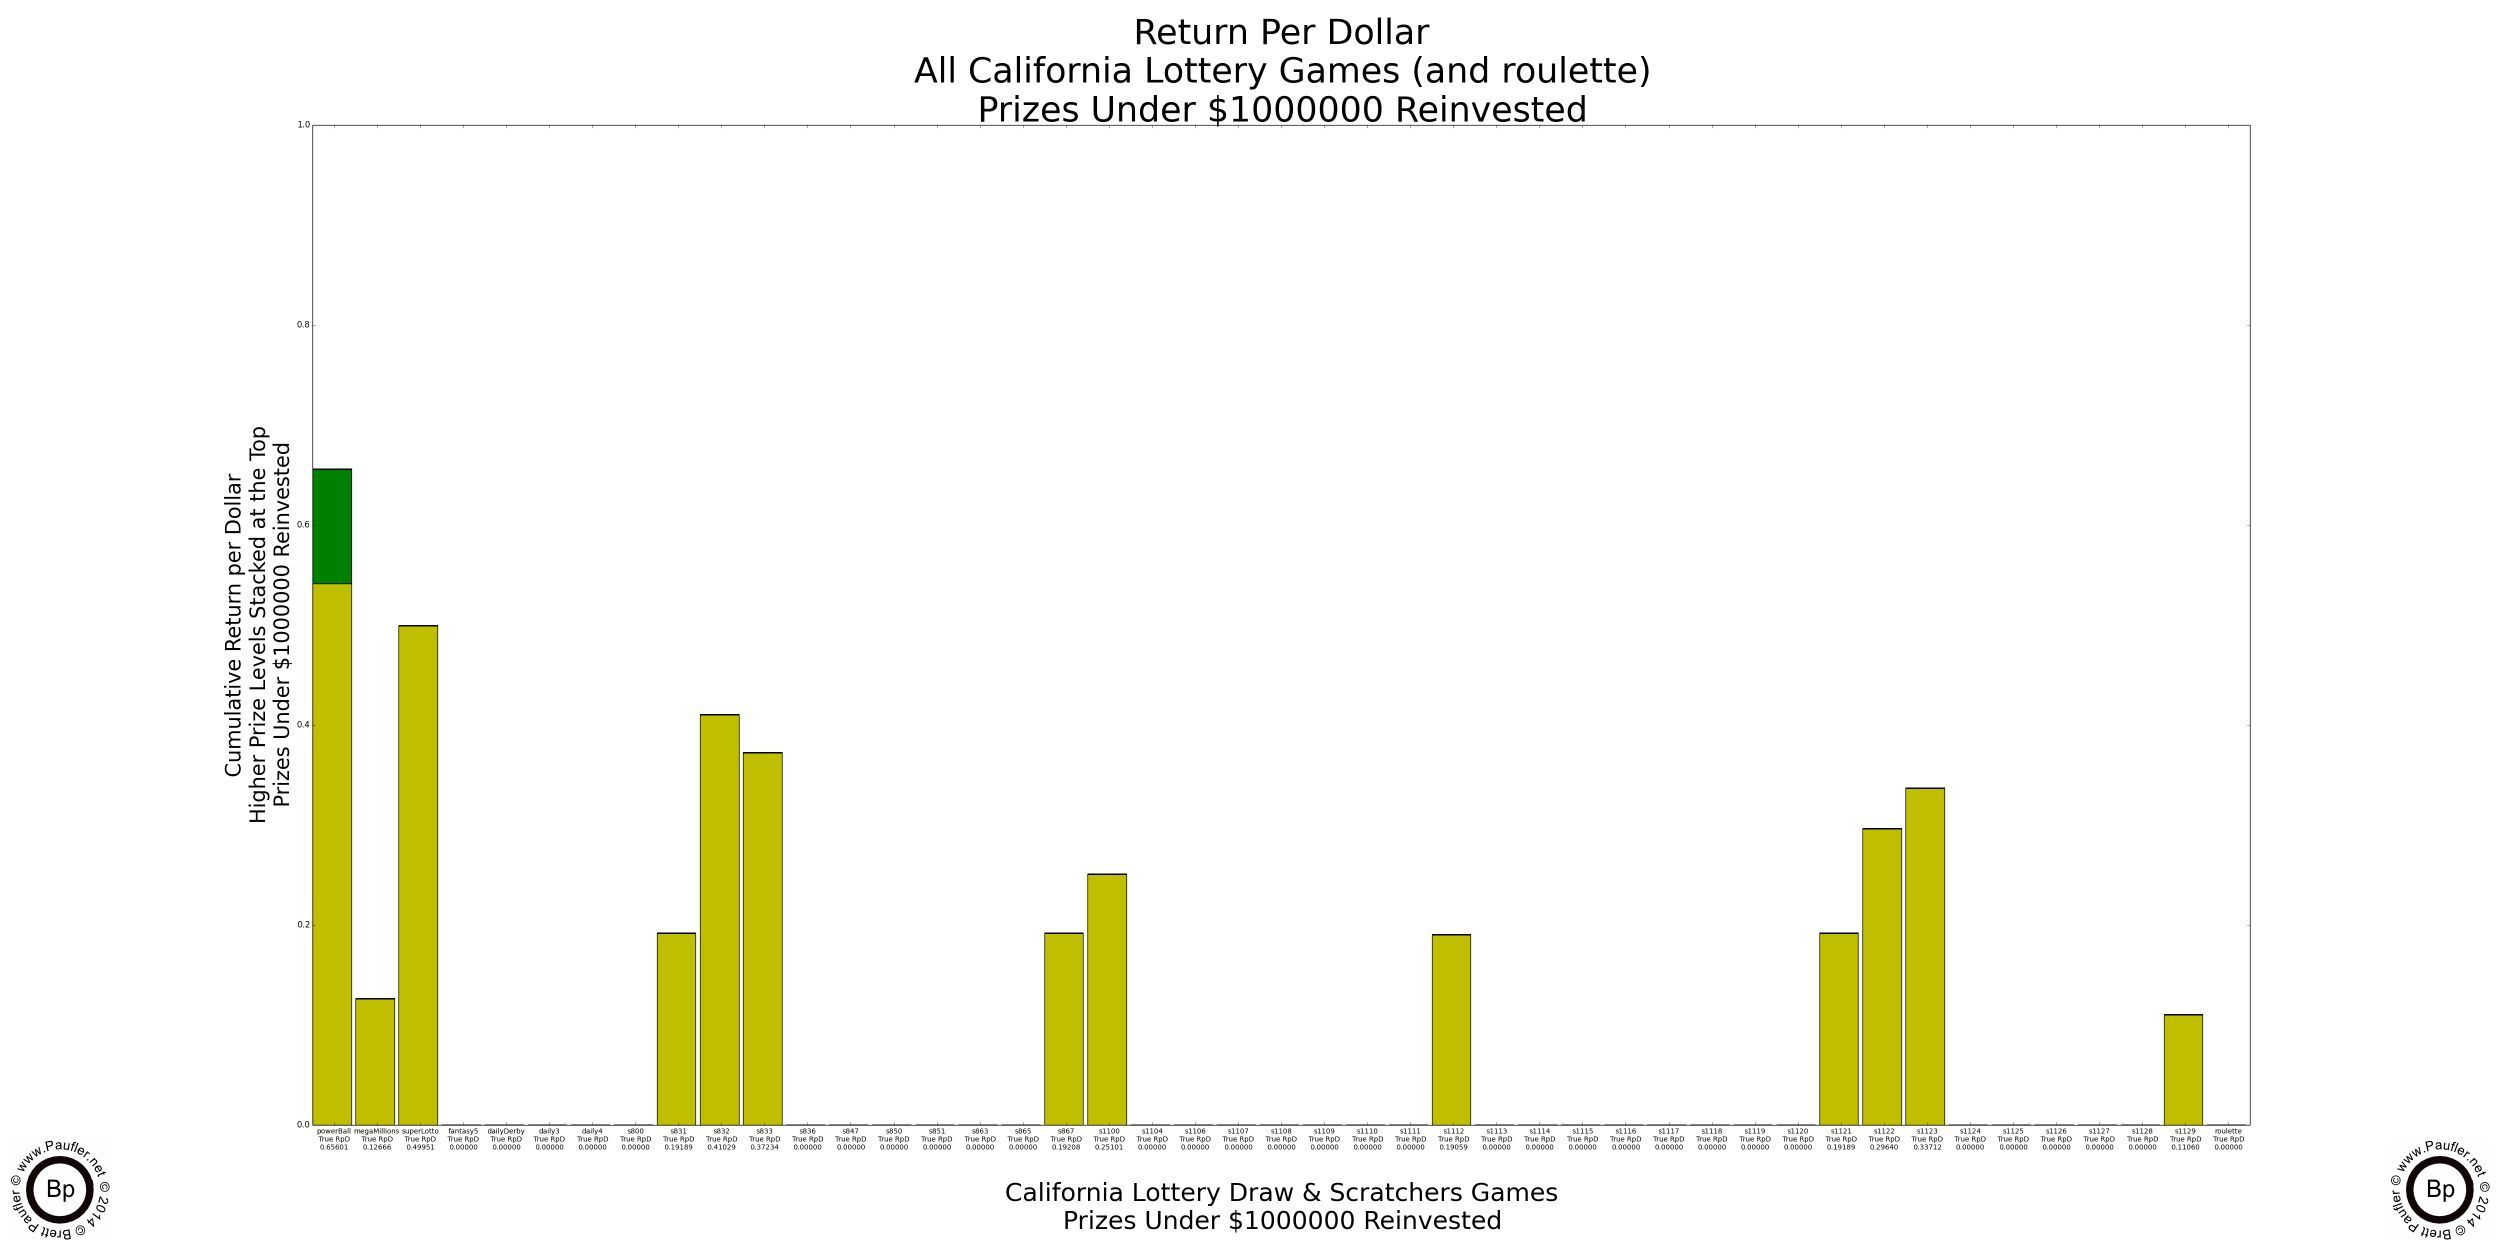
It probably doesn't make a heck of a lot of sense to reinvest a $100,000 prize (much less a $1,000,000 one). I know I wouldn't. But the reason to do so will become evident soon enough (it's the only way to compare the higher prize amounts apples to apples). But before we get there, I found an error in my calculations. Whoops!
First, it would be at this point that I located a (rather small?) error in my odds charts for the Daily Double game. I had transposed Win & Race Time and Trifecta prize amounts (per the corrected chart below).
Daily Derby Data Table
*These Two were flipped originally.
| Category | Prize | Odds |
| Trifecta & Race Time | $167,000 | 1,320,000 |
| Exacta & Race Time | $4,500 | 147,000 |
| Win & Race Time | $455* | 13,200 |
| Race Time Only | $47 | 1,001 |
| Trifecta (1-2-3) | $45* | 1,321 |
| Exacta (1-2) | $24 | 147 |
| Win (1) | $2 | 13 |
It's a small error in a game I'm not overly interested in (when I look to entertainment in the lottery, Daily Derby, I'm looking at you), so I'm not going to redo all the previous charts that I did for this page just because of this error. It's just not worth the time and effort. Suffice to say, the results for the Daily Derby before this point are incorrect to some (I believe, small) degree. And if you're primarily interested in that game, well, you have been warned. I did, however, notice this while I was working on the Return per Dollar with Reinvestment Charts, so those have been updated.
But Where There's Smoke There's Always Fire
Have I mentioned how NOTHING on this page is guaranteed? Well, this is why.
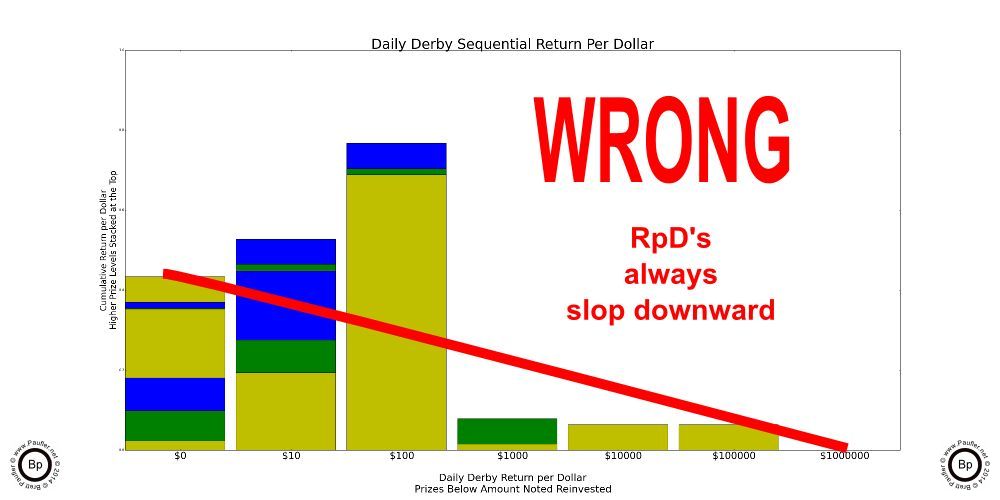
The only reason I was reviewing the Daily Derby Odds Chart was because I'd gotten some weird results. The chart on the left is wrong. It's just WRONG. I'd graphed out the Return per Dollar charts and when I looked at them in series, I noticed that at a certain level of reinvestment, the Return per Dollar for the Daily Derby went up. Well, this is wrong. In a game that has a House Edge, which the Lottery does (unless the jackpot has gotten so big that's it has become a Positive Odds Game, which it hadn't at this point, as that would take something like a $1,300,000 jackpot for the Daily Derby and it was only at $132,000), the Return per Dollar simply gets lower the more one plays. I mean, come on, we're not idiots. We all know that gambling is a losing proposition. The more one gambles, the less money they can expect to have. So a result that showed an increase in the Return per Dollar from increased gambling activity (which is what reinvesting one's winnings is) was simply wrong.
Long story short, I found the error and redid my charts. But I relate this story, because that was an error I caught. There could be other errors in my analysis... easily. In fact, I'm certain that there are several small insignificant errors in here somewhere. There just have to be. And though, I think I've found all the big ones. What can I say? I didn't think I had an error in my charts the first time I graphed them out. So, really, who knows about now?
Me, I trust my analysis. I'm willing to put MY money on it. But if I were you, I'd cross my own t's, if you know what I mean. And if you don't, please read the disclaimer at the end of the page. In the meantime, I believe it's time to wind this thing down and put all that we've learned together into one easy to use chart. But first, a review...
Prize Level - Odds of Winning - Fairness of the Game
Everything one needs to know about a gambling proposition in a nutshell.
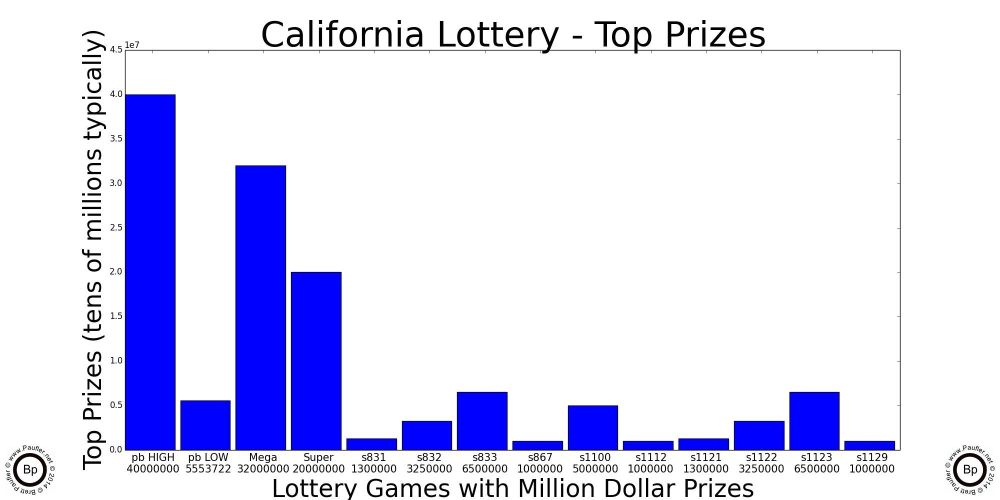
For a serious gambler (one who is willing to bet at least $20; and so, who is able to choose amongst all of the California Lottery's offerings) the above three graphs represent all the available data on which to make a lottery ticket buying decision.
PRIZE (left): the higher the prize, the better.
CHANCE (middle): the higher the chance (1/odds), the better.
RETURN (right): the higher the return, the better.
So, really, the decision making process should be simple enough: all one need do is pick the game that has the highest bar in each graph and...
Well, so let's do that. On 7-11-14 (the date for which this data is valid), the decision would appear to be simple enough. Power Ball tops all the charts. But Power Ball really is two games in one as there are two major jackpots: one for $40,000,000 and another for $5,553,722 with the top jackpot driving the Prize chart and the second jackpot driving the odds and RpD charts.
So, um, maybe I'm going to have to separate out those two prizes somehow, which really isn't going to be as easy as it might sound, since one always has to buy both wagers. I mean, the simplest methodology would be to treat the jackpots as two stand alone and separate wagers; and then, if either stands on its own, one can bet on that and view the other jackpot as a sort of free spin, so let's see how we can do that.
Power Ball Analysis Options
Why I'm bothering with this might not seem altogether clear, so let me try to explain, once again. Power Ball has two big jackpots (one at $40,000,000 and one at $5,553,722 for the 7-12-14 draw). And for certain draws (say for the draw I happened to base my calculations upon or I'd likely never have bothered to delve into this) it might make sense to play the game for one jackpot but not the other. Anyway, the specifics of my test data aside, the generalized question becomes, how can one tell when the Power Ball is worth playing -- whether it be for the high jackpot, the low jackpot, or both?
Now, this might not concern the casual gamer. But the purpose of this article is to put together a methodology for picking the best game at any one time. And to do that, I can't simply leave the two jackpots lumped together (if confounds the graphs: the high jackpot drives the prize graph, while the low jackpot drives the chance graph). Nor can I simply ignore the lower jackpot: it's a major prize and there are probably times when playing the Power Ball just for the lower jackpot is the best game in town. So, the question is, how to break out the two jackpots. And the easiest way would be to simply run the analysis twice: once ignoring the high jackpot; and then again, ignoring the low jackpot. But that won't work (for me, at least) as I want to be able to know for any given draw which game is the best; and just like there will be times Power Ball is best just because of the low jackpot, there will be times when Power Ball is the best game in town due to a combination of both the high and low jackpots. So, how to combine the two?
Well, I already have a sort of methodology. In both the Chance and Return per Dollar graphs above, I was more than happy to reinvest $100,000 prizes (knowing full well that I would never buy $100,000 worth of lottery tickets if I ever won such a sum), so as to be able to compare apples to apples. So, I decided to 'reinvest' the lower jackpot when analysing the higher jackpot and 'reinvesting' the higher jackpot when analysing the lower jackpot. And the graphs below show the outcome of that procedure.
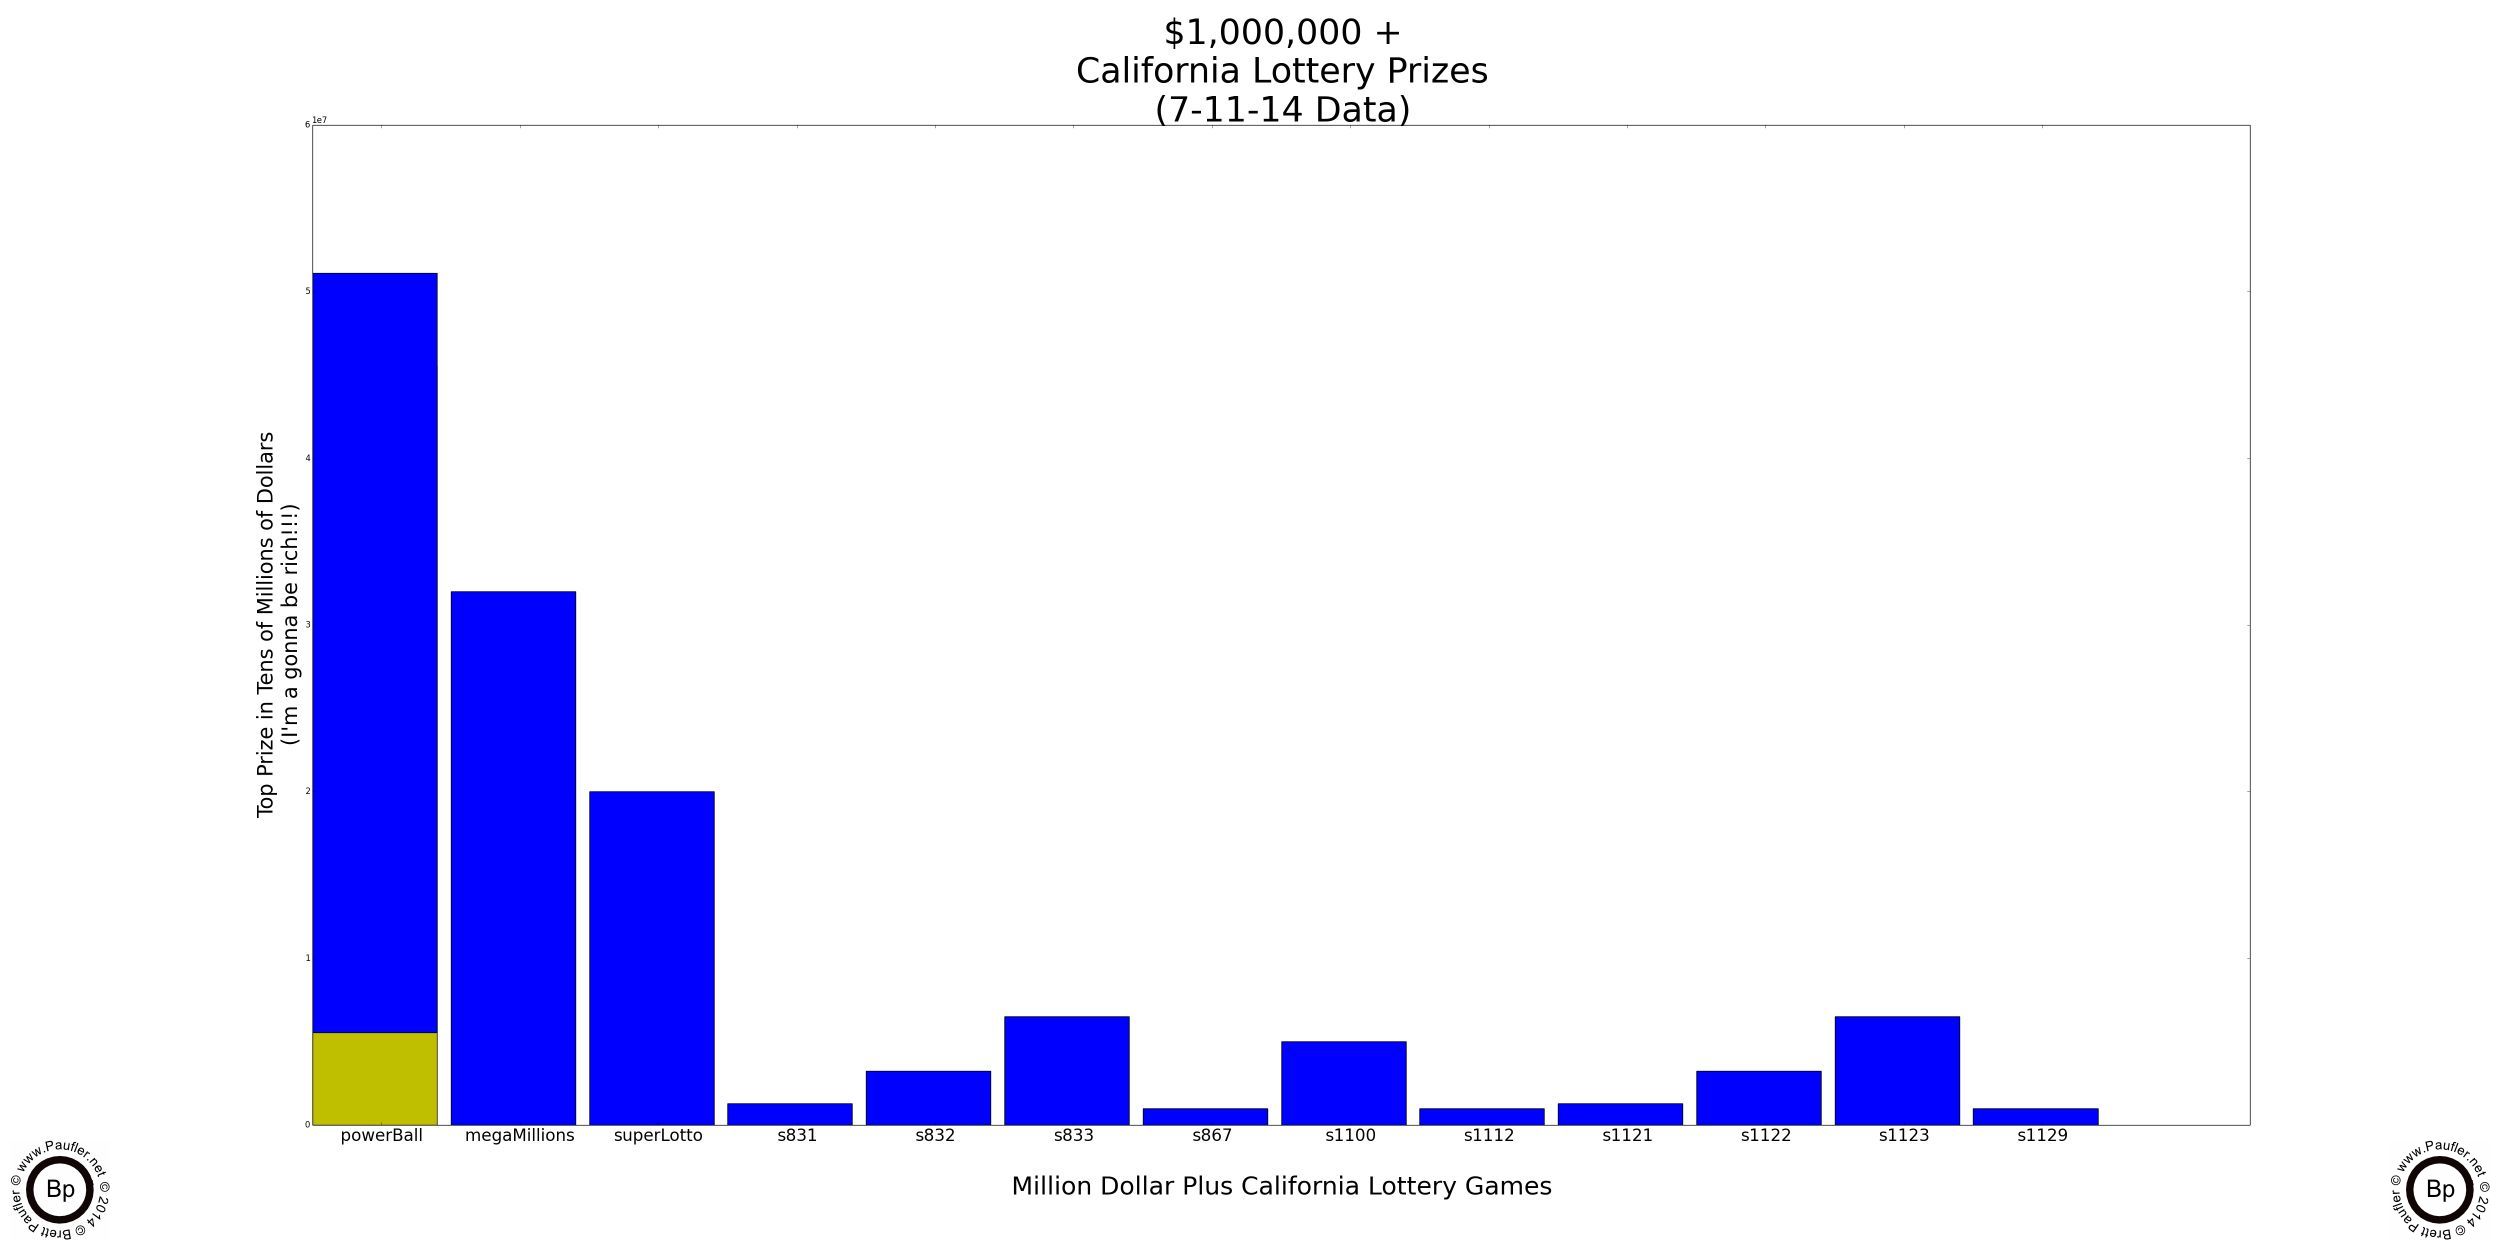
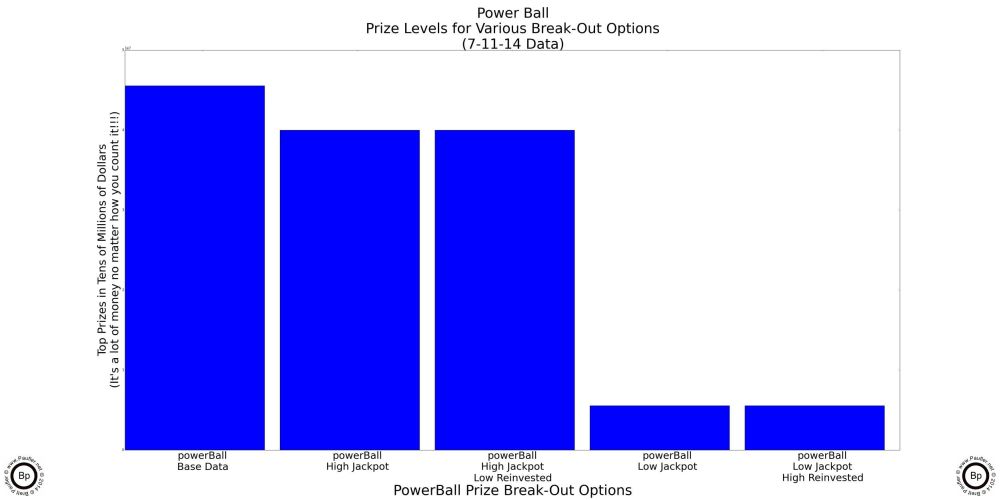
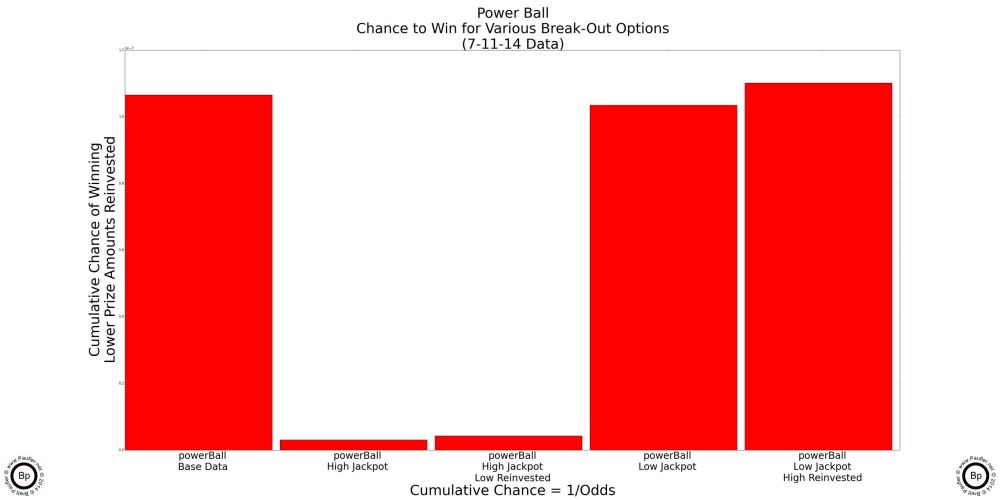
California Million Dollar Plus Jackpots
Power Ball Split by High Jackpot and Low
First Bar is for the High Power Ball jackpot, low reinvested.
Second Bar is for the Low Power Ball jackpot, high reinvested.
And in those charts is a complete lottery analysis.
So, how does one choose the best game?
It's a subjective question; and so, doesn't really have an answer. But common strategies might include:
PRIZE: go for the top prize. The logic is simple: the actual chance of winning is microscopically small and doesn't change that much from game to game (an opinion statement), so one might as well play for the biggest prize. If you agree with all that (I don't, but if you do), picking the best lottery game is a no brainer. Go for the one with the highest prize.
CHANCE per DOLLAR: is another perfectly fine metric to use and meshes perfectly with the philosophy that it is far preferable to win a small jackpot in this lifetime then wait several dozen lifetimes for a much larger jackpot (reincarnation not guaranteed nor is it underwritten by the authors of this website). I mean, one still might not win playing the better odds games (and in fact, one still probably won't win), but the overall odds would certainly be better if one simply selected the game with the best chance to win and stuck with it.
But even better, Chance is not a dynamic metric. If we answer that question once, we've answered it until new games are introduced as the base odds don't change from draw to draw (only the prize amounts). So it's real-real-real easy to answer the question of which California Lottery Game will give one the best chance of winning a million dollars (per dollar of play) and that answer is games s887 & s1112.
Want to Win a Millione Dollars in the Lottery?
These two games offer the best odds (if not bang) for the buck.
| Number | Name | $$$ | Top Prize | Odds/Ticket | Odds/$ w/r | Chance/$ w/r |
| s867 | California Gold | $10 | $1,000,000 | 1 in 1,200,000 | 1 in 7,064,110 | 0.00000014 |
| s1122 | Ca Black Exclusive | $10 | $1,000,000 | 1 in 1,200,000 | 1 in 7,084,249 | 0.00000014 |
Odds/$ w/r = Odds per Dollar with Reinvestment
Chance/$ w/r = Chance per Dollar with Reinvestment
reflecting the above graphs
Both of these California Lottery Scratchers games are very nearly the same: $10 ticket price, $1,000,000 top prize, stated odds at 1 in 1,200,000, and both have very limited secondary prizes (the next highest prize for both is $20,000 at the same odds as the top prize). However, the two games are not completely identical as some of the lower level prizes differ and that results in s867 having slightly better odds (after reinvestment) for the top prize.
Now, I don't know about you, but I have a very little desire to lock myself into $10 scratchers, so it makes sense for me to cast the net a little wider. Yes, I like to gamble. Yes, I like scratching off tickets. Yes, I'd rather buy a stack of tickets rather than just one. Which is an acknowledgement that there are other things that I consider when purchasing tickets than a mathematical analysis.
Want to Win a Millione Dollars in the Lottery?
But don't want to buy $10 Scratchers?
lower price alternatives
| Number | Name | $$$ | Top Prize | Odds/Ticket | Odds/$ w/r | Chance/$ w/r |
| s831 | California Lucky for Life | $2 | $1,300,000 | 1 in 6,000,000 | 1 in 7,518,424 | 0.00000013 |
| s832 | California Lucky for Life | $5 | $3,250,000 | 1 in 2,400,000 | 1 in 7,823,367 | 0.00000013 |
| s1121 | California Lucky for Life | $2 | $1,300,000 | 1 in 6,000,000 | 1 in 7,518,424 | 0.00000013 |
Note: this analysis based on Chance alone.
Please Note: There are two different series of Lucky for Life games; and since, only the $5 Lucky for Life showed up in the top charts, I'd steer clear of that game and simply play the $2 version knowing that both editions of this game provide very nearly identical odds for winning over a million dollars.
Thus, in summary, if Chance per Dollar was my goto metric: I'd probably buy a mix of the $10 and $2 games, maybe on a dollar for dollar basis: 1 $10 ticket to 5 $2 tickets. Obviously, I'd be watering down my odd in order to get a little gameplay action.
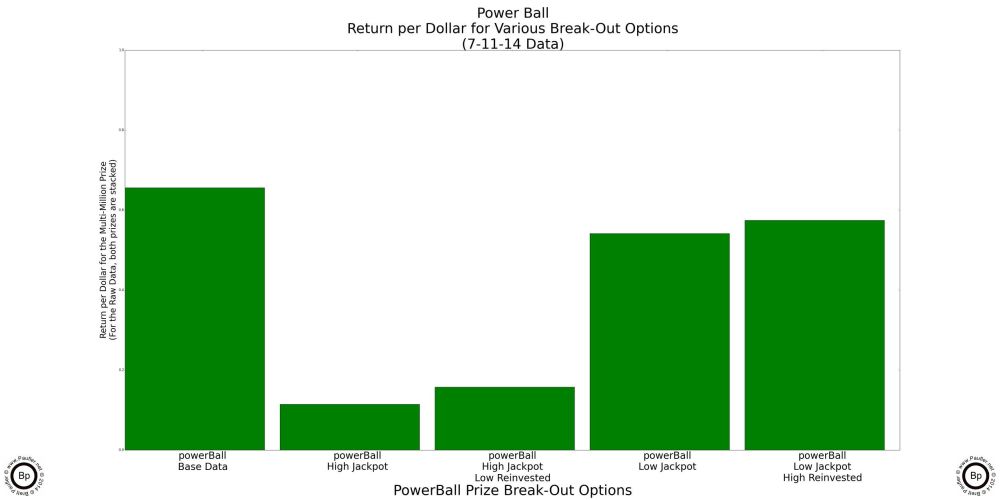
All of which leads us to our final metric:
RETURN per DOLLAR: I mean, chance is all fine and dandy, but does the prize align with the risk? Chance doesn't really address this. Return per Dollar does.
Remember:
RpD = Prize / (Odds * TicketPrice)
which is equivelant to
RpD = Prize * ChancePerDollar
As such, RETURN per DOLLAR is a single handy dandy metric that combines all the meaningful factors of a lottery game ticket buying decision (normalized for ticket price and the size of the jackpot, to boot).
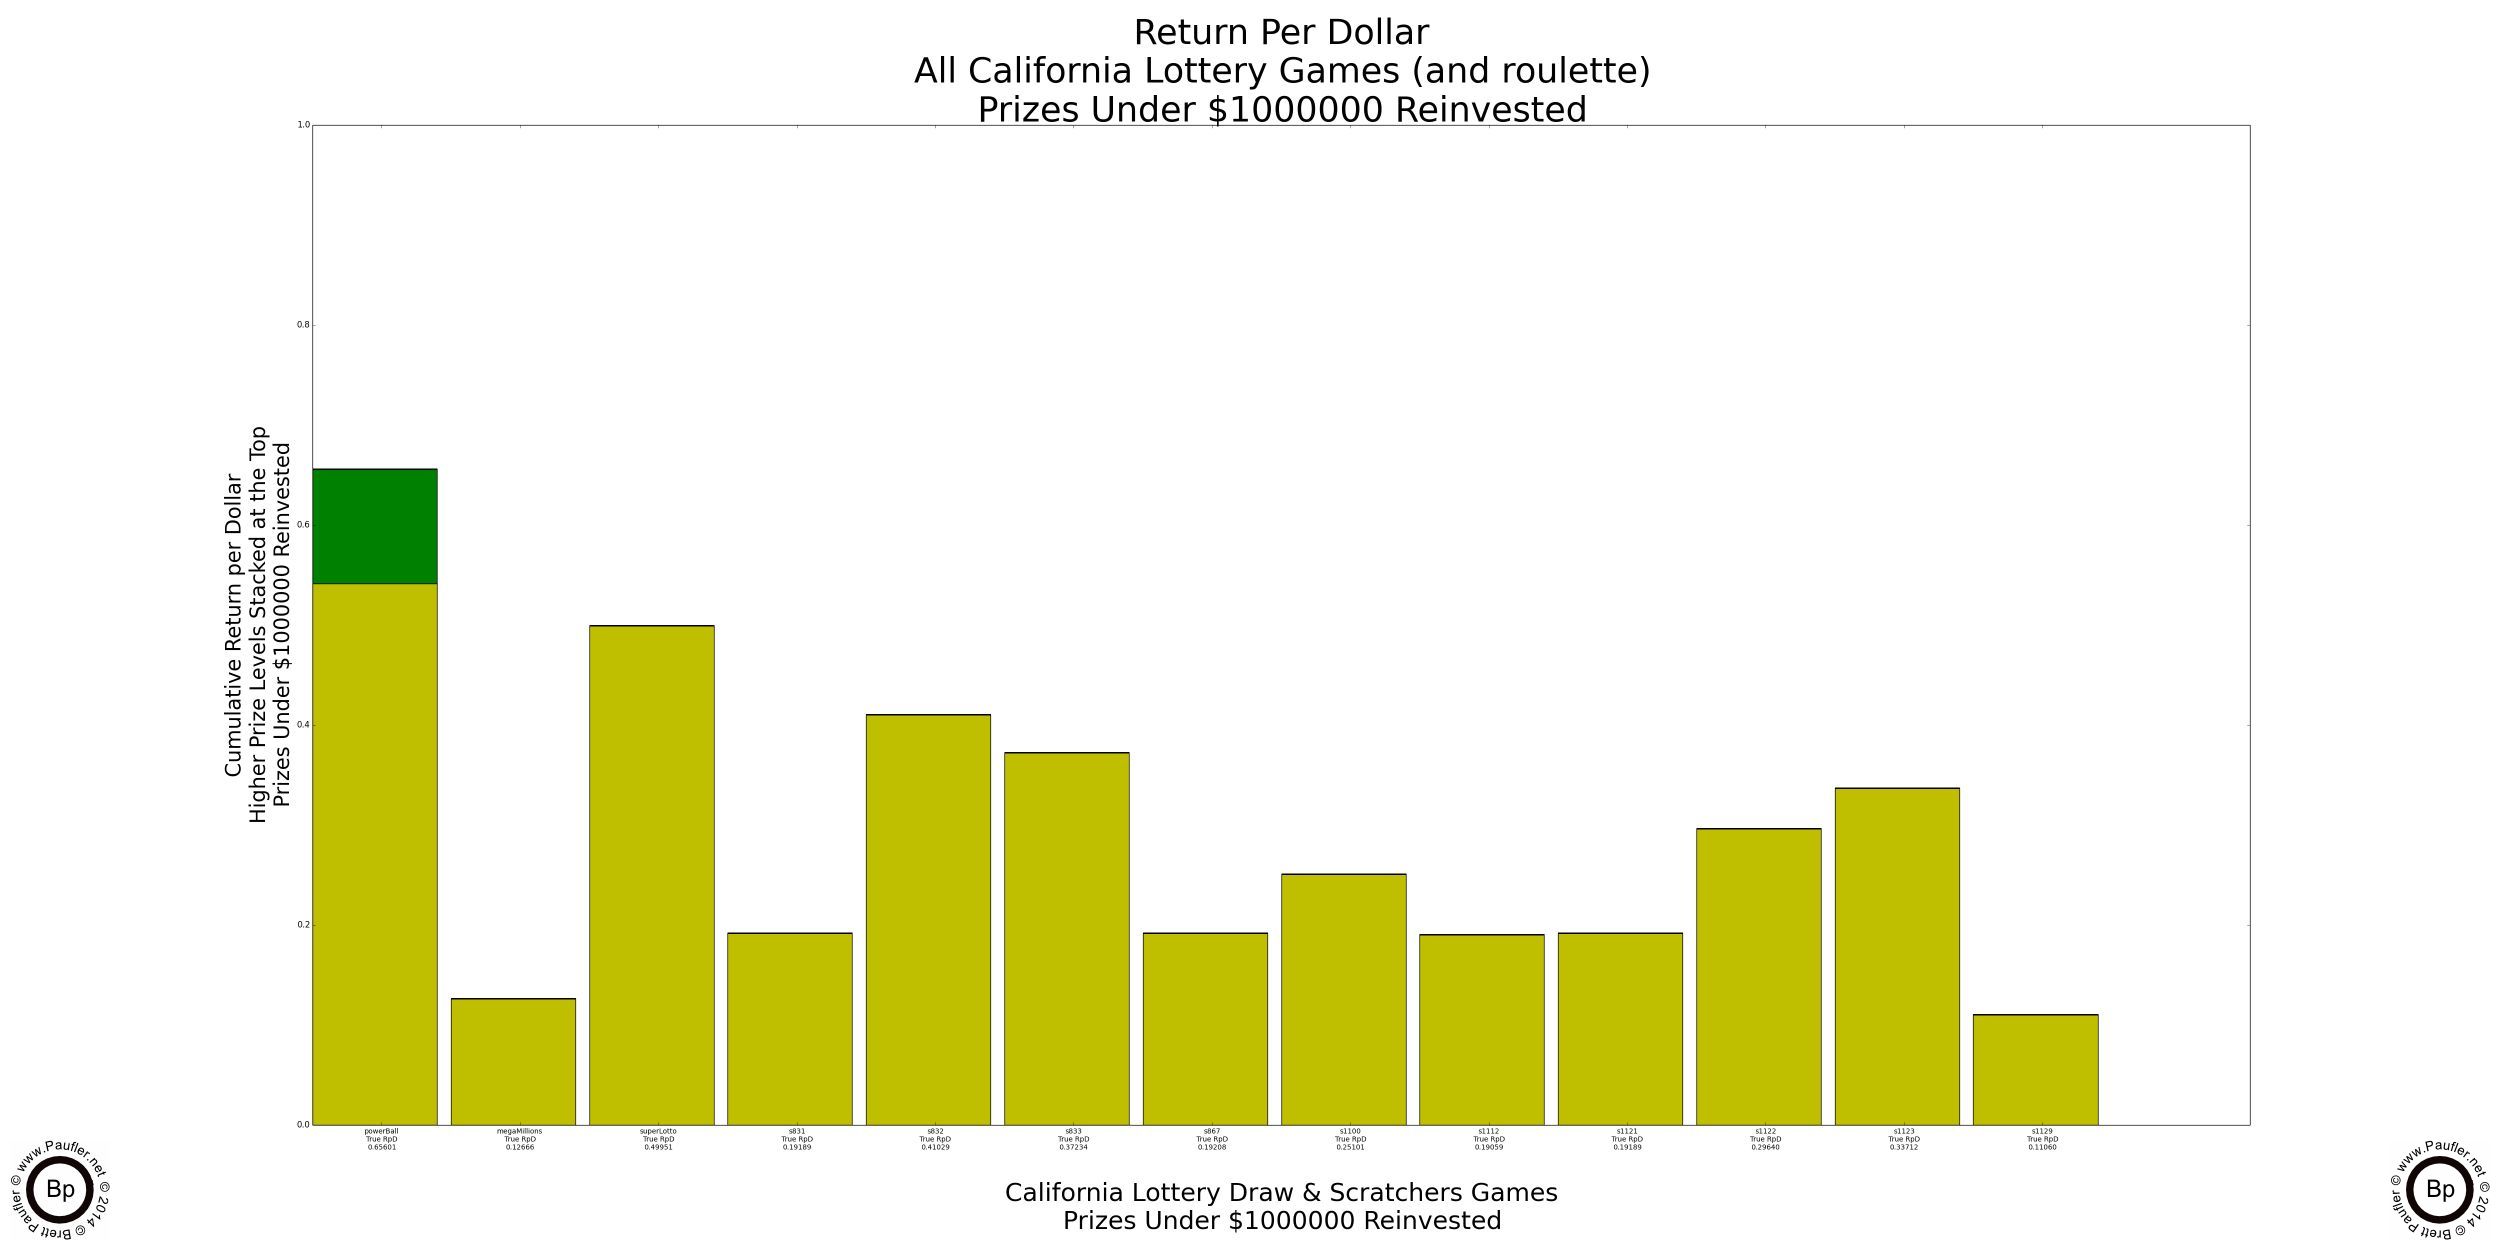
For the data presented above (based on the 7-12-14 draw, collected 7-11-14), the clear winner in the Return per Dollar category is the Low Jackpot for the Power Ball.
But that conclusion only holds for that particular draw and the data that is required to reach that conclusion changes from draw to draw, so any meaningful analysis will have to take that into account. But having analysed the scratchers once, we don't have to continue comparing them time and time again, because they're static. Until a new scratcher game is introduced, we can select a best of category for all scratchers games. And for Return per Dollar the two best scratchers games are:
Return per Dollar
Best Scratcher Games with Prizes a Million and Higher
| Number | Name | $$$ | RpDTop Prize |
| s832 | California Lucky for Life | $5 | 0.41029 |
| s833 | California Lucky for Life | $10 | 0.37234 |
Once again, it should be noted that there are two different California Lucky for Life games; and unfortunately, the series with the best Return per Dollar was the first series (perhaps already discontinued, so buyer beware).
And that's a sort of answer to the question of what's the best California Lottery game to play if one wants to make a million dollars. A player can't go too far wrong playing either of the above games.
And for the 7-12-14 draw, the Low Jackpot for the Power Ball beats out Super Lotto by a small margin, so I'd probably go in with a mix on the two games (probably dollar for dollar). But we all know it's no longer 7-12-14, data for that draw is a bit dated, and next week (assuming none of us have won in the meantime), we're all going to be back in the same position of deciding which games to play and the Return per Dollar charts I drew up for the 7-12-14 game just aren't going to be any good. And although it might be much handier to have a simple website that only posted a single Return per Dollar graph, at the moment, tapping the lottery database dynamically on the fly and then automatically output a graph is, well, beyond my humble programming abilities. So, the next best thing is a look up chart (graph really), which a person can use to eyeball the different games, compare them apples to apples, and determine where to lay their bets.
But if I ever do put together a dynamic website with daily updates, I'll put the link here. Or if you would like me to put together some custom graphs for a particular draw, well, let's just say that I can be bought and leave it at that. But seriously, why you would want to part with hard cash (that could be much better spent buying additional lottery tickets... any lottery tickets) when the charts below are free for you to use, I simply could not say.
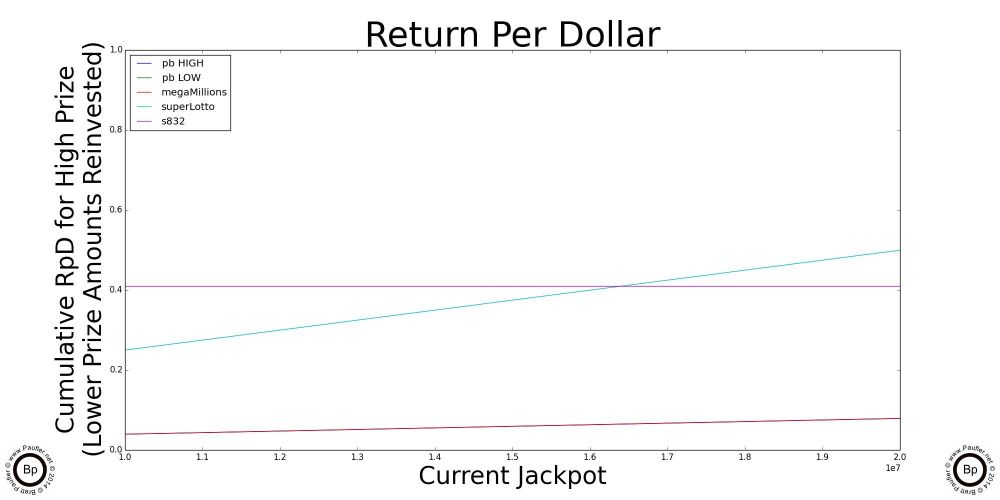
A Simple Graph by which to Compute the Return Per Dollar for the Major California Lottery Jackpot Games
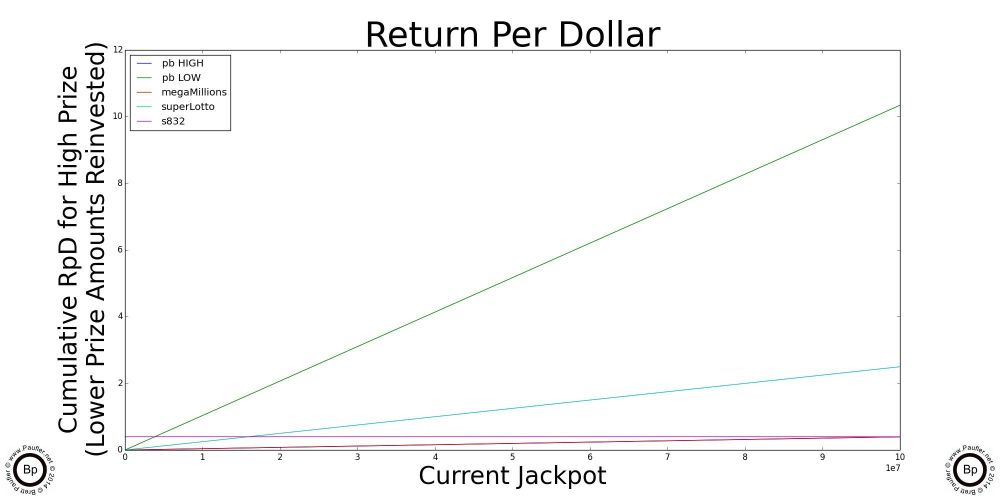
The chart above is really all one needs know about Return per Dollar and the California Lottery. And so, if you understand this one, you'll quickly realize that all the others that follow are just highlights (enlarged sections) and special cases of this one.
So, to read the graph:
1) Trace along the bottom of the graph until you get to the current jackpot amount for the game in question. Yeah. OK. The scale for this graph is 1-10 1e7 (whatever in whoever's name that means, ten million to a hundred million would be my guess; but seriously, I've always sucked at exponents).
2) Anyway, having found the place along the bottom that corresponds to the current jackpot, move vertically until you intersect with the line that corresponds to the game in question (so, different jackpots will align with different lines)
3) Either follow that point over horizontally to note the number or simply note which jackpot intersects its line at the highest point and that's the game with best Return per Dollar.*
* All rights reserved. Patent pending. This site is supported by generous gamers like you who having utilized this system graciously (or not so graciously, I'm really not particular) choose to donate 1% of their winnings (or more, we'll happily take more) to the upkeep and support of this valuable resource. And, of course, towards making bigger freaking graphs!!! Oh, speaking of which...
The Point of Inflection
Cross Over Points
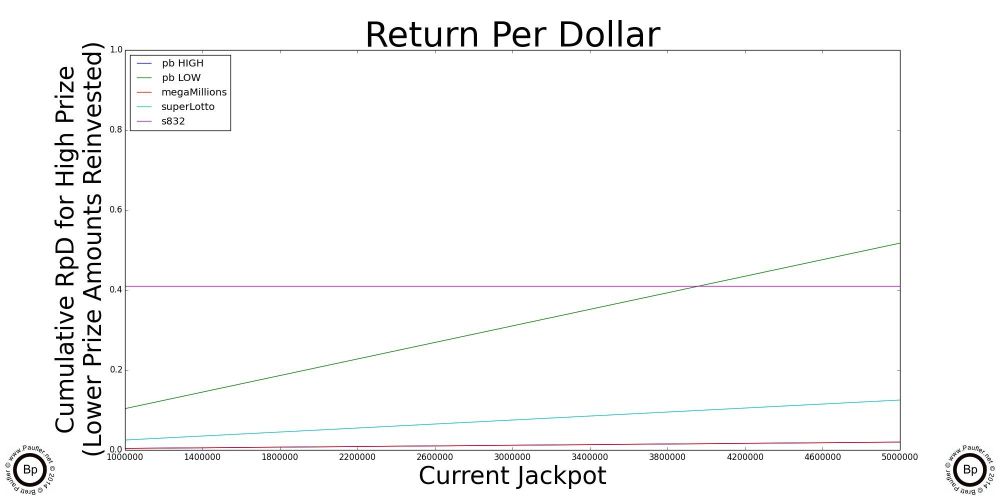
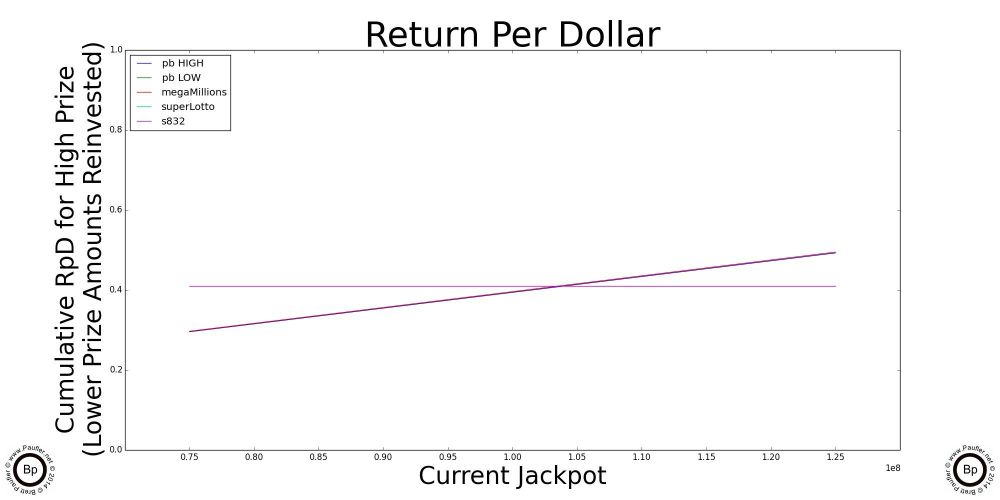
Highlighted above are graphs of the where the jackpot of each of the individual draw games cross over the 'best' scratchers jackpot. Below this point, the scratchers outlined in the previous section are better plays. Let someone else build up the jackpots. Or, er, what I mean to say is, the lottery is intended for entertainment purposes only and you can be sure I'll join in the fun after the jackpots Cross OverTM. In the meantime, please feel free to play without me.
Ironically (unfortunately, coincidently), the High Jackpot for the Power Ball and the Mega Millions have the same graph line for the data I used, but that's not always the case.
If you remember (and/or if you read all of the preceding), the methodology I decided to use to compute best game included the decision to virtually reinvest the winnings from Low Power Ball Jackpot while computing the RpD for the High and do the opposite for the low. Or in other words, a picture is worth a thousand words...
Power Ball Jackpot InterDependence Graphs
Low Jackpot on the Left - - High Jackpot on the Right
< LOW LEFT - - HIGH RIGHT >
(because I have a hard time remembering)
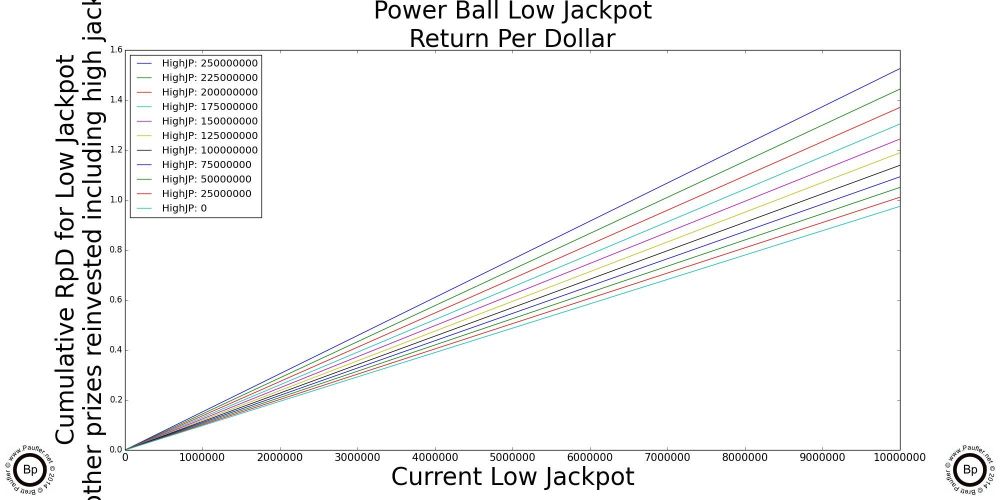
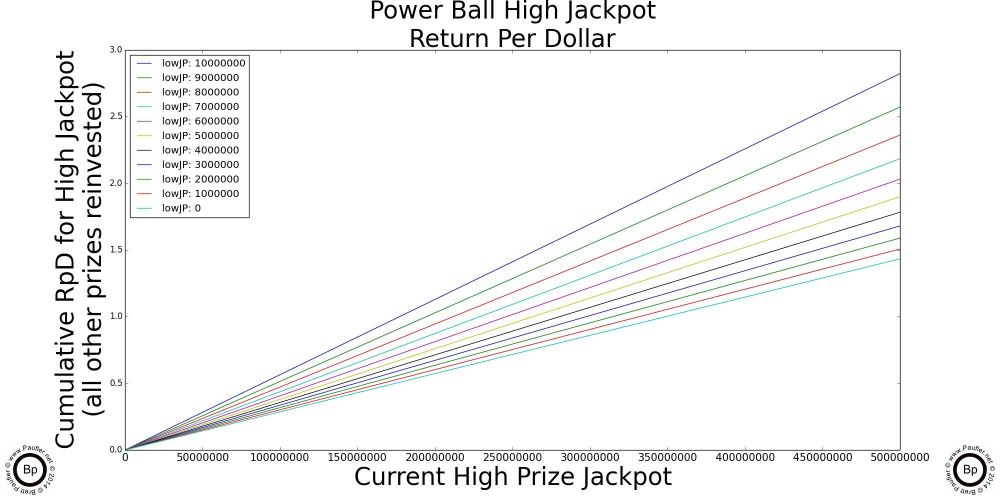
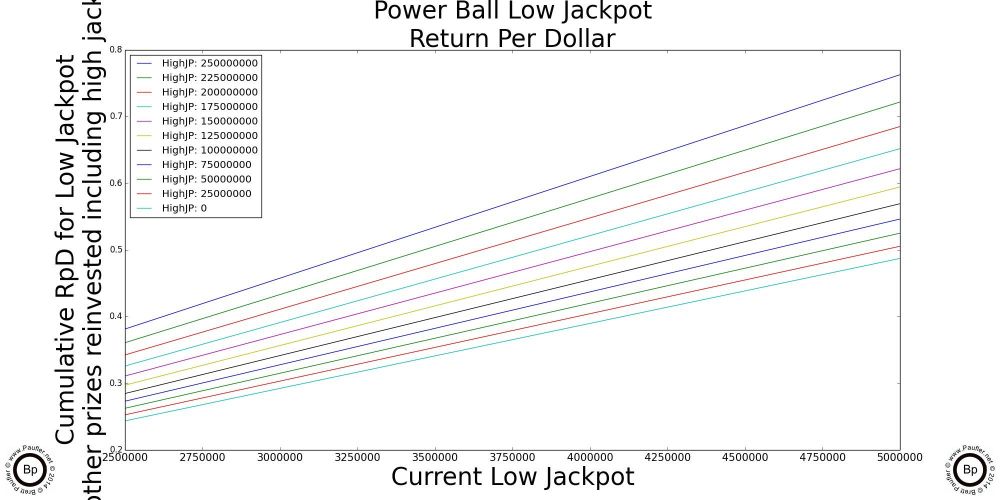
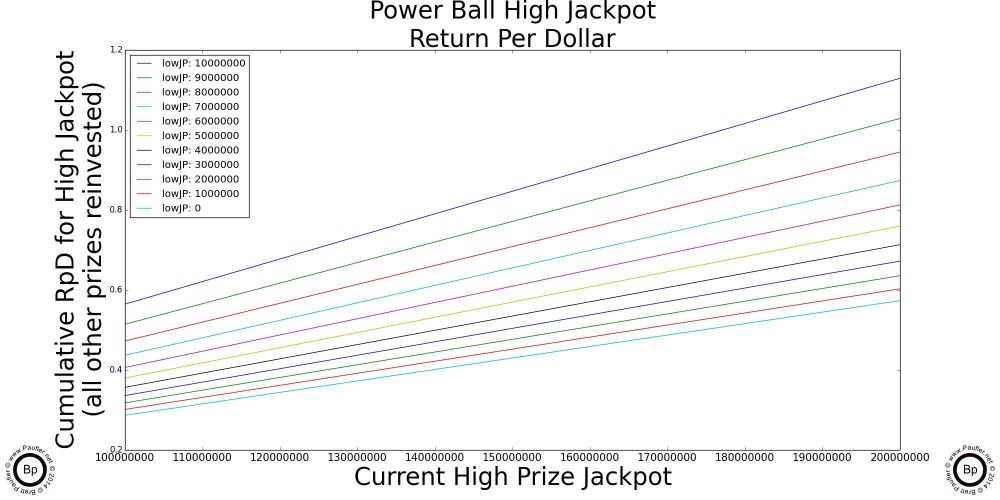
These work pretty much the same as the previous the only difference being that the line one matches up to is determined by the value of the other jackpot (the line used for the Low Jackpot is determined by the High Jackpot and vice a versa.
As an example if the High Power Ball Jackpot was $210,000,000 and the Low Power Ball Jackpot was $4,000,000; to figure out the Low RpD, we'd use the graph on the left (low, left), look for the third line from the top (red, $200,000,000), sort of eyeball how high it is at $4,000,000 (the Low Jackpot amount) and come up with a Low RpD of around .525. Simple.
And to figure out High RpD, we'd use the graph on the right (right, high), fifth line from the bottom lines up with the Low Jackpot amount in question ($4,000,000), and eyeball how high that line is at the example High Jackpot amount of $200,000,000, and come up with a value for the High RpD with something in the range of 0.60. Both of which are higher than the best Scratcher RpD of 0.40, so unless any of the other Draw Games had a better RpD, we'd (or at least I) would be playing the Power Ball that week. Like I said, simple.
Bigger is Better
Bigger Jackpots, Bigger Graphs
Seriously, nothing new here. Just bigger graphs one each dedicated to
< < Super Lotto - - Mega Millions > >
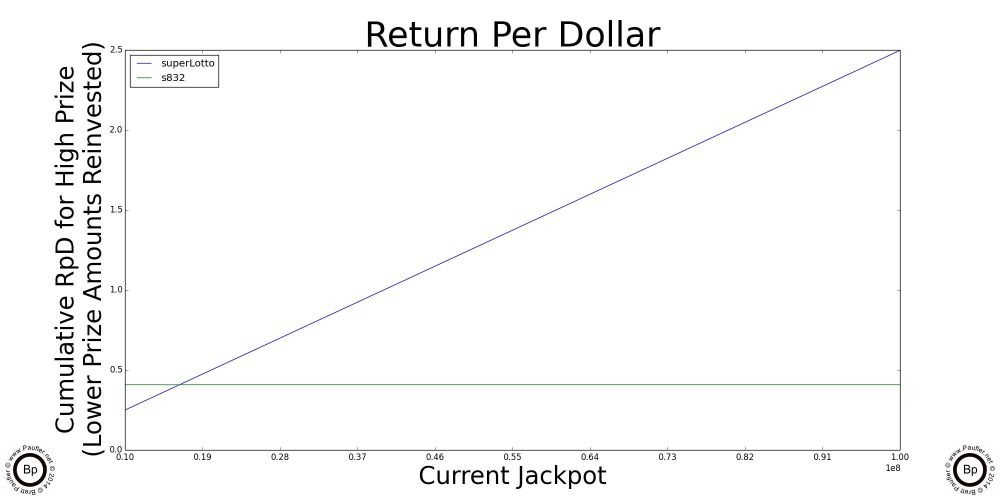
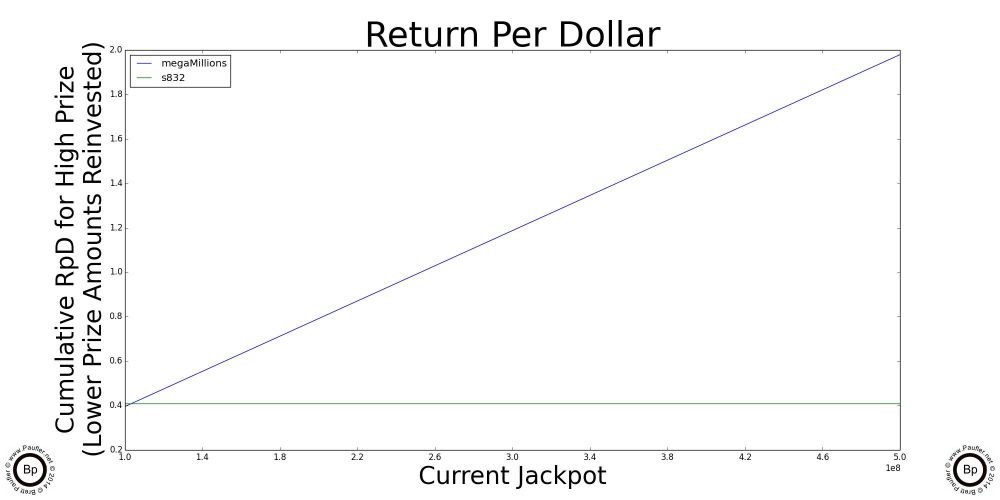
And there you have it.
My California Lottery Betting System.
I hope you have enjoyed the ride.
Remember: a Return per Dollar system will NOT maximize one's chances of winning. To do that, all one must do is pick the game with the best odds (i.e. use a Chance Based Analysis per preceding). What a Return per Dollar system does is maximize one's winnings over the long haul. In other words, if one were to play for a million-zillion years, betting the same amount on each draw each time betting on the game with the highest Return per Dollar, one would expect to have more Dollars Returned to them and thus have a higher total than a gambler who utilized either a Chance Based System or a High Prize System. However, ALL PLAYERS would (using any system) would expect to have LESS MONEY that if they simply HAD NOT GAMBLED AT ALL. Eat your Ovaltine Kids! And remember, gambling is a sucker's bet.
You would not believe how many lottery tickets I had to purchase in order to do all the 'research' writing an article such as this requires.
Anyhow (random begging aside), if you found this page of use and would like daily updates, please email me. If enough people express an interest, I'll put together a page that updates daily and provides information on the current draw conditions.
Or, you know, I've said it before, I'll say it again, I can be bought.
Also feel free to send along any comments, concerns, or corrections. Have a better metric that Return per Dollar, I'd love to hear about it.
I've got one heck of a rambling disclaimer posted somewhere on this site and everything on that page applies to this article as well: complete Terms of Service
But the short form version of the disclaimers goes something like this:
I might be wrong somewhere.
I'm probably wrong somewhere.
I am neither a professional mathematician, gambler, statistician, graph maker, nor programmer.
There might be errors in my analysis from any and all of these factors, perhaps other categories of which I am not even aware.
And they might be very significant in nature undermining all of my conclusions.
Personally, I don't think that's the case, but those who are wrong so seldom realize that they are.
So...